

Our Infrastructure Matters Ad
Home Blog Page 13

The New Jersey Turnpike was meant to be free. So what happened?


When the New Jersey Turnpike opened to drivers in the early 1950s, it came with a promise: tolls were temporary. 

The plan was to charge drivers until the cost of building the highway was paid off. After that, the road would become part of the state highway system and toll booths would come down.

To build the Turnpike, the state issued $250 million in revenue bonds, the largest toll-road bond issue in the country at the time. These bonds were designed to be paid off over 35 years, and once they were retired, toll collection was supposed to end. Early Turnpike brochures proudly noted that state law provided for the highway to become toll-free once the debt was cleared.

This idea was not unique to New Jersey. In the mid-twentieth century, other toll roads like the Garden State Parkway and New York Thruway made similar promises. The toll was framed as a temporary user fee, not a permanent cost for drivers.

What Changed?
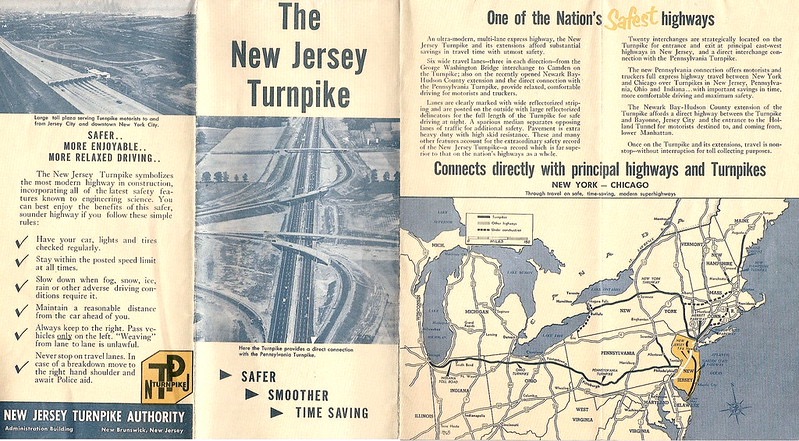
The original NJ Turnpike brochure from 1956. Courtesy of John on Flickr.

Several things happened to derail that original vision. First, the Turnpike quickly became a vital piece of infrastructure as traffic surged beyond expectations. That led to expansions, including widening projects, new interchanges and a major 1956 connection to the Pennsylvania Turnpike. Each new project required additional funding, and that meant more bonds. With every new round of borrowing, the timeline for removing tolls was pushed further into the future.

The Turnpike Authority was also set up as a self-funding agency. It was responsible not only for debt payments but also for the day-to-day operation of the road, including maintenance, snow removal, and policing. If the tolls had disappeared, the state would have needed to step in and fund those costs through taxes or general revenue. That never happened. Instead, it was politically easier to leave tolls in place.

By the 1970s and 1980s, the idea of a toll-free Turnpike had largely faded. Rather than phasing tolls out, the state began raising them periodically to keep up with inflation and to pay for ongoing upgrades.

Toll Money Finds New Uses

In time, toll revenue became more than just a way to fund road maintenance. It became a tool for financing broader transportation goals. During the late 2000s, Governor Jon Corzine backed a plan to increase tolls significantly. Between 2008 and 2011, tolls on both the Turnpike and Garden State Parkway were doubled. The revenue was supposed to help fund the Access to the Region’s Core (ARC) rail tunnel and other large-scale transit projects.

Although the ARC tunnel was later canceled, the toll money remained in use. By 2014, more than $300 million in annual toll revenue was being directed to NJ Transit and the state’s general transportation fund. Money that had once gone exclusively to the Turnpike was now helping cover the costs of buses, trains, and other infrastructure.

This shift also changed the political landscape. Tolls became a convenient funding source that did not require raising taxes. The Turnpike and Parkway were producing over a billion dollars in annual toll revenue combined. Removing tolls or even freezing rates would have left a massive hole in the state’s transportation budget.

What Tolls Look Like Today

Fast forward to the present, and tolls are not only still in place, they are rising. As of 2024, a one-way trip down the full length of the Turnpike in a passenger car costs about $20 with E-ZPass. Drivers without E-ZPass pay even more through license plate billing.

In 2020, the state approved a new policy that allows for annual toll increases of up to three percent. While the toll booths themselves are beginning to disappear, replaced by electronic tolling and license plate readers, the fees are as present as ever. The state has moved toward a cashless system in the name of efficiency and traffic flow, but the cost of driving the Turnpike continues to grow.

The Road Ahead

For those who remember the original pitch, the current situation feels like a broken promise. What was once framed as a short-term fee to build a highway has turned into a permanent and growing cost for drivers.

At the same time, the funding reality is hard to ignore. The Turnpike and Parkway carry millions of vehicles each year and require constant maintenance and upgrades. Without tolls, the state would need to find billions in new revenue to keep them running.

It should also be noted that approximately 1/3 of all New Jersey Turnpike traffic (and 1/2 of heavy truck traffic) is from out-of-state drivers. Tolls enable the state to make those out-of-state drivers pay for maintenance and upkeep. Without tolls, many would get a free ride. 

There are no serious proposals on the table to eliminate tolls. Instead, the focus is on modernizing toll collection and expanding the roads to handle future traffic demands. While the booths may eventually vanish from the landscape, the tolls themselves are unlikely to go anywhere.

Sources

New Jersey Turnpike Authority. (2024). Toll rates and information. Retrieved from https://www.njta.com/toll-rates

NJ Spotlight News. (2014, September 29). Turnpike tolls diverted to NJ Transit costs, not road maintenance. Retrieved from https://www.njspotlightnews.org

ROI-NJ. (2020, May 27). Turnpike Authority approves toll hikes to fund $24 billion capital plan. Retrieved from https://www.roi-nj.com

The New York Times. (2007, October 10). Corzine’s toll hike proposal aims to fund state debt and transit projects. Retrieved from https://www.nytimes.com

CentralJersey.com. (2026, January 27). How to use winter road salt responsibly. Retrieved from https://centraljersey.com/2026/01/27/how-to-use-winter-road-salt-responsibly/

New Jersey Department of Transportation. (n.d.). Municipal Aid Grant Program overview. Retrieved from https://www.state.nj.us/transportation/

Faces of the Environment: Mike Martucci, EPA Region 2 Administrator


At the Crossroads of Environment, Industry, and Community

When President Donald J. Trump appointed Mike Martucci as Regional Administrator for EPA Region 2 in early 2025, the announcement landed with particular resonance across New Jersey and the Hudson River Valley. Region 2 is one of the most environmentally complex jurisdictions in the country—home to the nation’s highest concentration of Superfund sites, dense urban pollution, fragile coastal ecosystems, and communities still recovering from climate‑driven storms. Martucci steps into the role with a blend of political experience, business leadership, and agricultural stewardship that shaped both expectations and skepticism.

From the Hudson Valley

Martucci’s public identity was forged in the Hudson River Valley, where he built a school transportation company from a single bus into one of the largest operators in the region. He also ran Masker’s Orchard, a family farm in Orange County, and became known locally as a steward of open space and farmland. His agricultural background—rare among EPA regional administrators—has long informed his rhetoric about balancing environmental protection with economic vitality.

His political career began with his election to the New York State Senate, representing a district that spans Orange, Ulster, Delaware, and Sullivan Counties. In Albany, Martucci earned a reputation as a Republican willing to champion conservation measures. He supported New York’s Environmental Bond Act and sponsored legislation extending the Warwick Community Preservation Fund to 2050, protecting farmland and critical environmental areas for another generation. The New York League of Conservation Voters ranked him among the highest‑scoring Republicans in 2022—an unusual distinction in a polarized era.

This blend of business pragmatism, rural land stewardship, and bipartisan environmental work became central to the narrative surrounding his EPA appointment.

EPA Region 2

Region 2’s portfolio is vast: New Jersey, New York, Puerto Rico, the U.S. Virgin Islands, and eight federally recognized tribal nations. It includes some of the most challenging environmental legacies in the United States—industrial contamination, aging wastewater systems, coastal vulnerability, and environmental justice communities living near toxic sites.

Upon taking office, Martucci emphasized collaboration with career staff, praising the scientists, engineers, and attorneys who anchor the agency’s technical expertise. In an early interview, he described them as “incredible professionals” and signaled that he intended to lead cooperatively.

But his arrival coincided with a turbulent moment: the Trump administration’s push to shrink the federal workforce, including layoffs at EPA headquarters and regional offices. Martucci acknowledged the uncertainty, noting that he did not yet know how staffing levels would ultimately shake out, but insisted that the mission—clean air, clean land, clean water—would remain intact.

New Jersey

If Region 2 is complex, New Jersey is its crucible. The state has more Superfund sites than any other in the nation, a legacy of 20th‑century industrialization and chemical manufacturing. As Regional Administrator, Martucci is responsible for overseeing cleanup progress, community engagement, and coordination with the New Jersey Department of Environmental Protection (NJDEP).

While the EPA has not publicly detailed a Martucci‑specific New Jersey agenda, his early statements and meetings with state environmental commissioners suggest several priorities:

1. Accelerating Superfund Cleanups

New Jersey communities—from Camden to Garfield to the Passaic River corridor—have long demanded faster remediation. Region 2’s Superfund program is one of the largest in the country, and Martucci’s leadership places him at the center of decisions about cleanup sequencing, funding allocations, and enforcement actions.

His background in business and local government suggests a focus on “balanced environmental protection”, a phrase he has repeatedly used to describe the Trump administration’s approach. In practice, this could mean emphasizing redevelopment opportunities at remediated sites—an approach that resonates with many New Jersey municipalities seeking to convert brownfields into tax‑generating properties.

2. Strengthening Coordination with NJDEP

Martucci has connected early with New Jersey’s environmental leadership, signaling a desire for alignment on regional priorities. Given New Jersey’s aggressive state‑level environmental policies—including PFAS regulation, coastal resilience planning, and stormwater modernization—this coordination is essential.

3. Addressing Urban Pollution and Environmental Justice

Newark, Elizabeth, Paterson, and Camden face disproportionate pollution burdens. While the Trump administration has shifted away from the Biden‑era framing of environmental justice, Region 2’s longstanding community engagement programs remain in place. Martucci inherits these structures and the expectations of communities that rely on them.

The Hudson River Valley

Martucci’s connection to the Hudson River Valley is both personal and political. As a farmer and business owner, he has long advocated for preserving open space and protecting waterways. His legislative record includes:

  • Inland waterway designations that expanded protections for streams and tributaries across his district.
  • Open space preservation laws, including the Warwick Community Preservation Fund extension.
  • Support for the Environmental Bond Act, which funds climate resilience, water quality improvements, and land conservation.

These experiences shape his approach to regional environmental management. The Hudson Valley faces its own challenges—legacy contamination, storm‑driven flooding, and development pressure—and Martucci’s familiarity with these issues gives him a grounded perspective on the region’s needs.

Superfund Oversight: A Defining Responsibility

Superfund is where Martucci’s role carries the most national significance. Region 2 oversees dozens of high‑priority sites, including:

  • The Lower Passaic River (NJ)
  • Raritan Bay Slag (NJ)
  • Ringwood Mines/Landfill (NJ)
  • Gowanus Canal (NY)
  • Newtown Creek (NY)

While the EPA has not released Martucci‑specific policy shifts, his public statements and the administration’s broader environmental posture suggest several themes:

A. Emphasis on Efficiency and Redevelopment

The Trump administration has historically prioritized expedited cleanups and reuse of remediated sites. Martucci’s business background aligns with this approach, and Region 2’s Superfund portfolio includes many sites with redevelopment potential.

B. Navigating Workforce Reductions

Superfund cleanups rely heavily on technical staff—hydrologists, chemists, engineers. The administration’s layoffs could affect project timelines, and Martucci has acknowledged uncertainty about staffing levels. His ability to maintain momentum despite these constraints will be a key test of his leadership.

C. Maintaining Community Trust

Many Superfund communities—especially in New Jersey—have endured decades of contamination and broken promises. Martucci’s collaborative style may help sustain trust, but he will need to demonstrate tangible progress to meet community expectations.

First Impressions

Across interviews and public statements, Martucci consistently emphasizes:

  • Collaboration with career staff
  • Respect for scientific expertise
  • Balanced environmental protection
  • Partnership with state agencies

EPA leadership has described him as pragmatic and stakeholder‑oriented. His predecessor, Lisa Garcia, expressed concern about federal workforce cuts but acknowledged the importance of maintaining strong regional leadership.

Mike Martucci’s tenure at EPA Region 2 comes at a moment of profound environmental and political transition. His background in the Hudson River Valley, his legislative record on conservation, and his business experience position him as a figure who bridges environmental stewardship and economic pragmatism.

For New Jersey, his leadership will be judged largely on Superfund progress, coordination with NJDEP, and responsiveness to environmental justice communities. For the Hudson Valley, he represents a local voice elevated to regional authority. And for the EPA, he is a test case for how the Trump administration’s environmental agenda plays out in one of the nation’s most complex regions.

A Brief History of NJ Transit: Part I – Origin Story and Seeds of Doubt


[This is multi-part series on NJ Transit]

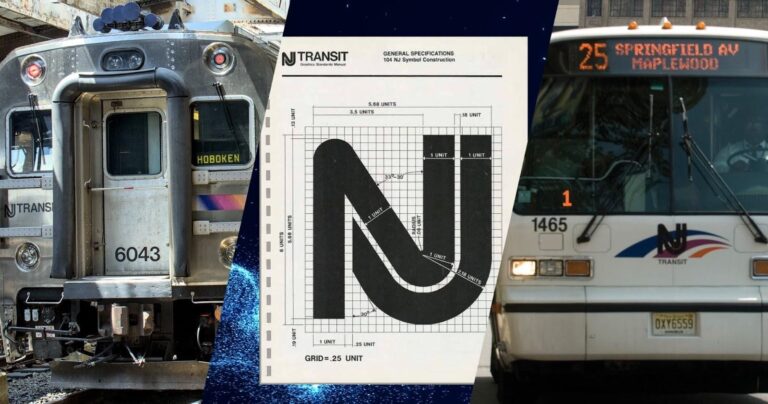
New Jersey Transit (NJ TRANSIT) is the nation’s largest statewide public transportation system, providing nearly 270 million passenger trips each year across 263 bus routes, 12 rail lines, and three light rail lines. The agency connects major employment centers, universities, and communities, supporting economic growth, environmental sustainability, and social equity. 

Yet, for nearly half a century, the agency has been dogged by a recurring pattern of fiscal instability—short-term fixes, capital-to-operating transfers, mounting debt, and deferred maintenance. With Governor Sherrill’s Executive Order to improve the NJ Transit rider experience, now is a good time to review the history of the agency and the funding and structural challenges that have led to this moment.

The 1980s: Birth Amid Crisis

By the late 1970s, New Jersey’s once-vibrant network of private bus and rail operators was collapsing under the weight of deindustrialization, suburbanization, and the lure of the automobile. In 1976, the federal government created Conrail to rescue failing railroads, but left New Jersey with a patchwork of services and no clear path forward. The New Jersey Public Transportation Act of 1979 established NJ TRANSIT to “acquire, operate and contract for transportation service in the public interest,” setting the stage for a new era of public stewardship.

In 1980, NJ TRANSIT acquired Transport of New Jersey, the state’s largest private bus company, and soon after, the Newark City Subway. By 1983, it had assumed control of commuter rail operations from Conrail, and by 1984, it was running bus service in Mercer County. These moves unified New Jersey’s fragmented transit landscape under a single public entity. But the systems NJ TRANSIT inherited were in dire shape. Decades of underinvestment had left buses and trains aging and unreliable. 

The agency launched a $772 million capital program, funded by federal grants and the newly established state Transportation Trust Fund (TTF, 1984), to renew its fleet and infrastructure. The average bus age plummeted from 13.5 to 4.5 years between 1979 and 1989. And as service reliability improved from FY 1983 to FY 1988, rail ridership surged 40%.

The 1980s funding model relied heavily on federal support through the Urban Mass Transportation Act and state backing via the TTF. The TTF, financed by fuel taxes and later by bonds, provided a dedicated—if not always sufficient—stream for capital projects. Still, the agency’s operating budget was vulnerable to annual appropriations and political winds in Trenton. When operating subsidies lagged behind rising expenses, the agency began to experiment with capital-to-operating transfers—using funds intended for long-term investments to plug short-term budget holes. This practice set a precedent that would haunt the agency for decades to come.

The 1990s: Expansion and New Projects

The 1990s were a period of optimism and growth. Total ridership increased by 22.8% over the decade, buoyed by economic expansion and new service offerings. The agency launched ambitious projects, including the planning and early development of the Hudson–Bergen Light Rail (HBLR), the River LINE, and the Newark Light Rail Extension. These investments were designed to support urban revitalization, reduce congestion, and connect growing communities to jobs and amenities.

Backed by federal New Starts funding and state-issued bonds, the HBLR aimed to kickstart transit-oriented development along the Hudson waterfront. By 1996, the Federal Transit Administration (FTA) had pledged $825 million—about 75% of the initial segment’s cost—contingent on performance metrics and ridership projections. The River LINE and Newark Light Rail Extension followed similar models, leveraging federal and state dollars for transformative infrastructure.

Yet, beneath the surface, the agency’s financial foundation was eroding. The Transportation Equity Act for the 21st Century (TEA-21) eliminated federal operating assistance for large urban transit agencies in 1998, slashing NJ TRANSIT’s federal support for day-to-day operations. State operating aid also declined, falling from $289 million in FY 1993 to under $150 million by FY 2000. Meanwhile, fares were frozen for much of the decade, and inflation-adjusted fare revenue actually fell by 19%.

To bridge the gap, NJ TRANSIT turned to alternative revenue sources—parking fees, station retail leases, and leveraged lease agreements—but these could not keep pace with rising costs. The agency increasingly relied on capital funds to cover operating expenses, diverting Section 5307 and 5309 federal formula funds at rates unmatched by any other U.S. transit agency. By the late 1990s, the agency was also issuing Certificates of Participation (COPs), pledging future federal grants to finance fleet purchases and other capital needs.

The result was a mounting debt burden. NJ TRANSIT’s debt grew from $351 million in FY 1996 to $1.65 billion by FY 1999. The state’s reluctance to establish a dedicated, recurring revenue source for transit left the agency dependent on a patchwork of annual appropriations, toll transfers, and one-time fixes. 

Sources

Bond, M., & DiPetrillo, S. (2025). From challenge to resilience: The evolution of NJ Transit funding and a roadmap to a reliable future. Alan M. Voorhees Transportation Center, Rutgers University. https://vtc.rutgers.edu/wp-content/uploads/2025/02/NJ-Transit-Funding-Report-2025.pdf

Reitmeyer, J. (2025, May 20). The financial questions that still hang over NJ Transit. NJ Spotlight News. https://www.njspotlightnews.org/2025/05/nj-transit-budget-deficit-funding-corporate-transit-fee

Reitmeyer, J. (2024, December 12). NJ Transit faces nearly $1 billion deficit as federal aid expires. NJ Spotlight News. https://www.njspotlightnews.org/2024/12/nj-transit-budget-gap-federal-aid-ending

Reitmeyer, J. (2024, March 7). Murphy proposes corporate transit fee to stabilize NJ Transit. NJ Spotlight News. https://www.njspotlightnews.org/2024/03/nj-transit-corporate-transit-fee-budget

Johnson, T. (2023, September 18). NJ Transit’s capital needs far exceed available funding. NJ Spotlight News. https://www.njspotlightnews.org/2023/09/nj-transit-capital-plan-funding-shortfall

Railway Age. (2025, May 22). NJ Transit Board approves $3.16B operating budget, $1.684B capital program. https://www.railwayage.com/passenger/commuterregional/nj-transit-approves-2026-budget

NorthJersey.com (Stile, C.). (2024, April 4). NJ Transit’s funding crisis decades in the making.
https://www.northjersey.com/story/news/columnists/charles-stile/2024/04/04/nj-transit-funding-crisis-history/72938460007

The Star‑Ledger / NJ.com (Higgs, L.). (2023, June 28). How NJ Transit used capital funds to cover operating costs for decades.
https://www.nj.com/traffic/2023/06/nj-transit-diverted-capital-funds-to-operations-for-decades.html

NJ Transit. (2025). FY2026 Operating Budget.
https://www.njtransit.com/sites/default/files/2025-05/NJT-FY2026-Operating-Budget.pdf

NJ Transit. (2025). FY2026 Capital Program.
https://www.njtransit.com/sites/default/files/2025-05/NJT-FY2026-Capital-Program.pdf

NJ Transit. (2024). Annual Ridership Trends Report.
https://www.njtransit.com/sites/default/files/2024-02/NJT-Ridership-Trends-2024.pdf

New Jersey Office of Legislative Services. (2024). Budget analysis: NJ Transit.
https://www.njleg.state.nj.us/analysis/2024/NJT-Budget-Analysis.pdf

New Jersey Turnpike Authority. (2024). FY2025 Financial Plan (including NJ Transit transfer).
https://www.njta.com/media/2025-financial-plan.pdf

U.S. Government Accountability Office. (2001). Commuter rail: Information on funding, ridership, and capital needs.
https://www.gao.gov/products/gao-01-214

Federal Transit Administration. (2023). National Transit Database: NJ Transit profile.
https://www.transit.dot.gov/ntd/data-product/nj-transit-profile

Managing the State’s Surging Energy Demand [NJ Business]

0


A new study by consulting firm Grid Strategies reports that while peak electricity use is expected to increase between nearly four and six percent over the next five years, the expected growth rate will require planning and building six times more new generation and transmission capacity. The forecast said there could be overestimates on growth, but even conservative estimates would require significant grid growth. AI data centers are among the key factors contributing to the demand increase.

Read the full New Jersey Business Magazine article here.
https://njbmagazine.com/monthly-articles/managing-the-states-surging-energy-demand/

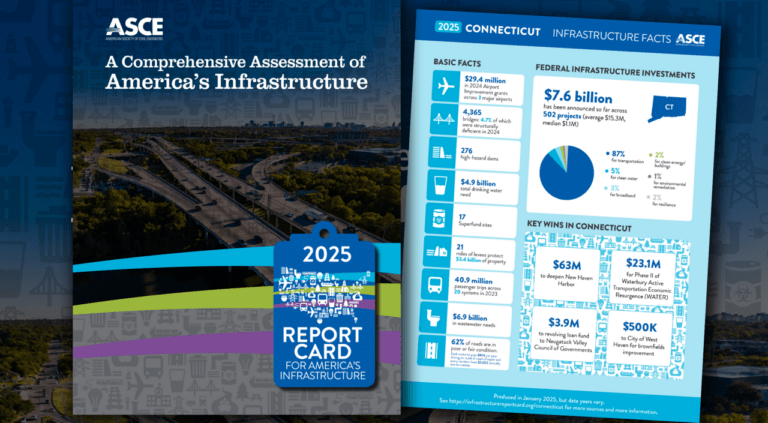
Connecticut’s ASCE Infrastructure Report Card

0


The American Society of Civil Engineers’ Infrastructure Report Card evaluates infrastructure systems using grades from A to F based on condition, capacity, funding, resilience, public safety and future needs.

Infrastructure conditions are improving in Connecticut, particularly in the transportation and water infrastructure sectors. Several categories showed incremental progress in recent years, reflecting stronger maintenance practices and new investment. Still, long-term funding gaps challenge the state’s ability to modernize infrastructure.

The most recent evaluation examined five key infrastructure sectors: bridges, drinking water, rail, roads and wastewater. Grades ranged from B for rail to D+ for roads, with an overall infrastructure grade of C.

Roads: The State’s Lowest-Rated Infrastructure

Roads received the lowest grade of any infrastructure category in Connecticut, earning a D+.

Much of the state’s roadway network was built decades ago and is experiencing increasing wear from heavy traffic volumes. Connecticut is one of the most densely populated states in the country, and its roads carry a significant amount of commuter, freight and regional traffic. As a result, congestion and pavement deterioration remain persistent challenges.

There are 21,430 miles of roadways in the state of Connecticut; 19% of which are owned and maintained by the Connecticut Department of Transportation (CTDOT) and the remaining 81% by municipalities, of which 77% of local miles are in poor riding condition.

Water Infrastructure: Aging but Reliable

Connecticut’s drinking water systems received a C grade.

More than 97 percent of residents served by community water systems receive water that meets all health standards, exceeding national benchmarks. However, much of the infrastructure delivering that water is aging. Some pipes date back to the late 1800s and early 1900s, making rehabilitation and replacement a growing priority.

Over the next two decades, the state is expected to need more than $4 billion to maintain and upgrade drinking water infrastructure. Leaking water mains also contribute to losses estimated between 15 and 20 percent of total water production, highlighting the importance of ongoing investment and asset management programs.

Wastewater systems face similar challenges. Many treatment facilities and collection networks are decades old and require upgrades to maintain reliability and meet modern environmental standards.

Transportation Improvements

While roads remain the state’s lowest-graded infrastructure category, other transportation systems show stronger performance.

Connecticut’s bridges received a C, reflecting improvements in maintenance and inspection programs. State officials have reduced the percentage of bridges in poor condition in recent years, helping the state meet federal condition requirements.

Rail infrastructure received the highest grade at B, reflecting the strength of Connecticut’s passenger rail system, which connects closely with Metro-North Railroad and serves tens of millions of riders each year.

Investment and Workforce Needs

Federal funding from the Infrastructure Investment and Jobs Act is expected to provide Connecticut with more than $5 billion in infrastructure funding over five years, supporting transportation, water and resilience projects.

Even with that investment, civil engineers warn that a long-term funding gap remains between current spending and future infrastructure needs. Connecticut’s infrastructure is among the oldest in the nation, with many assets more than 50 years old.

The report also highlights workforce shortages as a growing challenge. Contractors, engineering firms and public agencies all report difficulty recruiting skilled workers needed to design, build and maintain infrastructure projects.

Looking Ahead

Connecticut has made measurable progress in several infrastructure categories, particularly in bridges and water systems. Continued investment, improved resilience planning and workforce development will be critical to maintaining that momentum.

Without sustained funding and strategic upgrades, however, aging infrastructure and growing transportation demands could continue to strain the systems that support the state’s economy and daily life.


Sources

American Society of Civil Engineers. 2022 Connecticut Infrastructure Report Card.
ASCE Infrastructure Report Card. https://infrastructurereportcard.org/state-item/connecticut/

NJ Senate Passes Bill Aimed at Data Center Energy & Water Use [ROI NJ]


The New Jersey Senate has approved a bill to require data center operators to provide energy and water usage reports to the New Jersey Board of Public Utilities (BPU). The bill calls for the owners or operators of data centers to submit reports within six months of its effective date. Under the bill, the reports would be published as an aggregated summary on the BPU website. Data center owners and operators would also be required to provide a 60-day notice of any operational or technology changes to their reported information.

For additional information about the bill and reporting requirements see the ROI-NJ story: https://www.roi-nj.com/2026/03/24/industry/energy-utilities/legislation-holding-data-centers-accountable-for-water-energy-use-passes-senate/

Energy reform bills move forward as lawmakers target costs and capacity [New Jersey Globe]

0


New Jersey lawmakers are advancing a broad slate of energy reform bills aimed at addressing rising utility costs and increasing demand on the grid. Measures cleared in committee would boost energy production, require large power users like data centers to rely on cleaner sources and explore changes to the regional grid system. The effort reflects a growing push in Trenton to improve affordability and hold grid operators accountable. 

Read the full article at the New Jersey Globe: https://newjerseyglobe.com/legislature/legislative-committees-go-all-in-on-energy-reform/

Understanding the forces behind rising electric bills in New Jersey

0


Public Service Enterprise Group (PSE&G) reported a strong financial year in 2025, posting net income of $2.11 billion, a 19% increase over the previous year, according to a recent ROI-NJ report. 

Rising utility profits often draw public scrutiny, especially at a time when energy prices are higher than ever. But the reality behind electric bills is complex and frequently misunderstood.

In New Jersey and across much of the country, local utilities like PSE&G are primarily responsible for transmission and distribution; the delivery of electricity to homes and businesses. That portion typically accounts for roughly 30% of a customer’s bill.

What utilities actually control

The remaining majority is tied to the wholesale cost of electricity, which is purchased through regional markets and fluctuates based on supply, demand and public policy.

That distinction matters. In PJM Interconnection, which manages the grid for New Jersey, capacity auction outcomes and tightening supply have played a significant role in recent price increases, forcing utilities to pass those costs through to customers.

Shrinking supply, rising demand

What is driving that tightening supply is a fundamental imbalance: New Jersey is producing less electricity in-state at the same time demand is rising. Over the past decade, multiple sources of reliable, around-the-clock power have been taken offline or reduced without equivalent replacement. The most notable example is the closure of Oyster Creek Nuclear Generating Station, which for decades provided steady baseload electricity before shutting down in 2018.

In addition, New Jersey and the broader PJM region have seen the retirement of coal-fired power plants and older natural gas facilities. While aging, these plants still provided consistent and dispatchable energy that could be relied on during peak demand periods.

Replacement generation has not kept pace. Former governor Phil Murphy hoped that offshore wind would offset the closure of Oyster Creek, the closure of the state’s last coal-burning plant, and several natural gas plants, but post-COVID inflation and supply chain challenges led to Danish energy company Ørsted cancelling what would have been New Jersey’s first offshore wind farms in 2023. Former New Jersey Sierra Club director Jeff Tittel said of Murphy, “He bet heavily on wind — and I’ll get some environmentalists mad at me — but the wind program got too big, too expensive, and they got too greedy, the wind companies, and it collapsed…He bet everything on wind, and he lost.”

The result has been a shrinking supply of in-state generation capacity at the exact moment when demand for electricity is rising at an unprecedented pace. In New Jersey alone, utility interconnection requests tied to data centers have jumped from roughly 400 megawatts to 4,700 megawatts in just one year, a more than tenfold increase. 

The natural gas disconnect

The conversation becomes more complicated when factoring in natural gas.

There is an important difference between direct natural gas supply, used to heat homes, and electricity generated from natural gas-fired power plants. Direct gas service is typically regulated and priced more predictably, which helps explain why utilities like PSE&G have been able to keep gas rates relatively stable, even holding them flat during parts of the recent winter season.

Electricity, however, increasingly depends on natural gas as a fuel source. As policies push toward electrification, more demand is shifted onto the electric grid, even as constraints are placed on expanding natural gas infrastructure. That dynamic can drive up wholesale electricity prices, particularly during periods of peak demand.

A growing dependence on imported energy

This dynamic is a key reason why energy costs are soaring. New Jersey is producing less power locally while simultaneously needing far more of it, forcing greater reliance on imported electricity in an increasingly constrained regional market.

Rising electric bills are not solely, or even primarily, driven by utility company decisions. Instead, they reflect a combination of market forces and policy choices that shape how energy is produced, delivered and priced.

As New Jersey continues to navigate its energy future, understanding these distinctions will be critical. Policymakers face a difficult balancing act: maintaining reliability, managing costs and meeting environmental goals, all while ensuring that affordability does not become an afterthought.

Sources

ROI-NJ. (2026, February 27). PSEG posts income increase for all of 2025, says it’s focused on minimizing utility rate hikes. https://www.roi-nj.com/2026/02/27/industry/energy-utilities/pseg-posts-income-increase-for-all-of-2025-says-its-focused-on-minimizing-utility-rate-hikes/

PJM Interconnection. (n.d.). About PJM. https://www.pjm.com/

U.S. Energy Information Administration. (2018). Oyster Creek nuclear generating station closure. https://www.eia.gov/

New Jersey Department of Environmental Protection. (n.d.). Energy and sustainability in New Jersey. https://www.nj.gov/dep/

New Jersey Board of Public Utilities. (n.d.). Energy pricing and markets in New Jersey. https://www.nj.gov/bpu/New Jersey Monitor. (2025, October 15). Governor Murphy’s energy policy scrutinized as his two terms wrap up. https://newjerseymonitor.com/2025/10/15/nj-governor-phil-murphy-energy-policy/

NJ green workforce initiative enters next phase with fresh funding [New Jersey Business Magazine]

he New Jersey Economic Development Authority Board has approved Phase 2 of the New Jersey Green Workforce Training Grant Challenge, expanding a competitive $4 million program to prepare residents for careers in the growing green economy. Grants of $500,000 to $800,000 will support workforce development initiatives that provide training, credentials and job pathways in green sectors, with a focus on serving New Jersey’s overburdened communities.

Read the full story at New Jersey Business Magazine: https://njbmagazine.com/njb-news-now/phase-2-of-the-nj-green-workforce-training-grant-challenge-approved/

Poop there it is! 

0


What sewage can tell us about public health

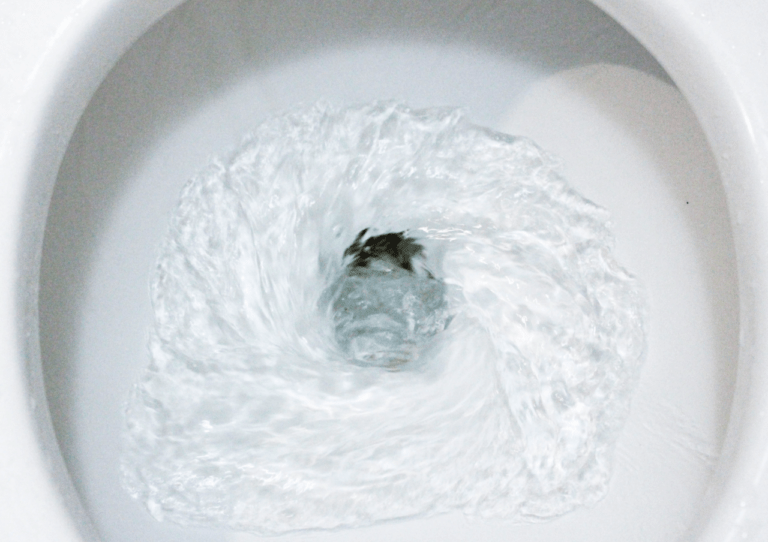
Every time we flush a toilet or wash something down the drain, we may be contributing to one of the state’s quietest public health monitoring systems.

The New Jersey Department of Health is using wastewater surveillance to track viruses circulating in communities across the state. By testing sewage from municipal sewer systems, scientists can detect traces of infectious diseases before large numbers of people even begin seeking medical care.

As New Jersey passes the six-year mark since the start of the COVID-19 pandemic, the state is continuing to rely on one of the quieter tools that emerged from that crisis: wastewater surveillance. Officials say the system helps provide an early snapshot of what illnesses may be spreading in a community.

At the moment, state health data shows typical seasonal respiratory viruses, including Influenza, Respiratory Syncytial Virus, and COVID-19, continuing to circulate across New Jersey.

But the way those trends are detected may surprise some residents.

How Wastewater Monitoring Works

The process relies on a simple biological fact: people who are infected with viruses or bacteria often shed microscopic particles of those pathogens in their waste, even if they do not yet have symptoms.

Those particles eventually end up in municipal sewer systems.

Public health officials use a multi-step process to monitor disease through wastewater:

1. People get sick
Individuals infected with a virus can shed particles of that pathogen through bodily waste.

2. Particles enter the sewer system
When toilets flush or sinks drain, viral and bacterial particles travel through underground sewer pipes along with wastewater from homes and businesses.

3. Samples are collected
Wastewater samples are taken from sewer interceptors and wastewater treatment plants, where sewage from thousands of households flows together.

4. Laboratory testing
Scientists analyze the samples in laboratories to identify genetic fragments of viruses or bacteria present in the wastewater.

5. Monitoring trends
Public health officials track the concentration of those pathogens over time. Rising levels can indicate that an illness is spreading more widely within a community.

Because wastewater combines waste from large populations, the system measures community-level health trends rather than individual infections.

Why Infrastructure Matters

Wastewater surveillance only works because of the sewer systems and treatment plants that move and process millions of gallons of wastewater every day.

Samples are collected directly from municipal wastewater systems, meaning the accuracy of disease monitoring depends on the reliability of that infrastructure.

Maintaining sewer pipes, pump stations and treatment facilities helps ensure that samples reflect what is actually happening across a community. Aging or damaged systems can disrupt sampling locations or alter wastewater flows, making monitoring more difficult.

In other words, the same infrastructure that quietly carries waste away from homes also supports one of the state’s growing tools for tracking public health.

The Role of Local Health Departments

Local health departments play a central role in responding when disease activity is detected.

Under New Jersey law, both the state health department and local health agencies have authority to investigate communicable diseases within their jurisdictions.

Guidance issued by the New Jersey Department of Health Office of Local Public Health explains that local health officers are responsible for investigating disease reports, determining whether outbreaks exist and taking steps to limit the spread of illness when necessary.

Healthcare providers and laboratories are required to report confirmed cases of communicable diseases through the state’s Communicable Disease Reporting and Surveillance System, allowing public health officials to track outbreaks and coordinate responses.

Local investigations may involve identifying sources of infection, working across multiple jurisdictions, and responding to cases that occur in public facilities or other community settings.

A Quiet Tool for Public Health

Wastewater monitoring may not be visible to most residents, but it has become an increasingly important tool for public health agencies.

By analyzing what flows through sewer systems, officials can identify disease trends earlier and better understand how illnesses are spreading through communities.

And it all starts with the same infrastructure people rely on every day, the pipes beneath the streets that carry wastewater away from homes and into treatment plants.