There could be a battle brewing after grid operator PJM’s proposed rule changes to fast-track large projects to serve data centers. The changes would allow connections to 10 proposed projects per year in 10 months as opposed to the multiyear backlog that currently exists. However, opponents say it favors natural gas fueled resources because it requires 500 megawatts to qualify and the projects must be completed in three years.
In the late afternoon of April 28, 2025, the Iberian grid was operating under relatively high renewable penetration, with wind and solar together accounting for more than half of instantaneous generation. A disturbance in the transmission system triggered a cascade of voltage instabilities. Because the majority of renewable plants in Spain and Portugal are equipped with grid‑following inverters, they were unable to provide the reactive power and voltage support needed to stabilize the system.
Within minutes, oscillations spread across the network. Conventional plants attempted to compensate, but their reduced share of generation left insufficient inertia and reactive power reserves. The result was a total system collapse, with both Spain and Portugal losing supply. Restoration took several hours, with priority given to hospitals, transport hubs, and critical services. The event was the most severe system collapse in Europe in over two decades, affecting tens of millions of people, halting transport, and disrupting industry across the Iberian Peninsula.
On October 3, 2025, the European Network of Transmission System Operators for Electricity (ENTSO‑E) released its long‑awaited factual report on the April 28 blackout. While the report stops short of assigning root causes—those will come in a final analysis due in early 2026—it provides a detailed chronology of events, identifies structural weaknesses in the Iberian grid, and highlights the urgent need to integrate grid‑forming inverter technology into renewable generation fleets.
The ENTSO‑E report emphasizes three key findings:
High Renewable Penetration Without Ancillary Services
At the time of the blackout, renewables supplied more than 50% of Iberian demand.
Nearly all of these plants used grid‑following inverters, which can only operate when a stable grid frequency and voltage are already present.
As a result, they withdrew from the grid during the disturbance rather than helping to stabilize it.
Regulatory Restrictions on Renewables
Until June 2025, Spanish grid codes (Operational Procedure 7.4) did not permit renewable generators to provide voltage support.
This regulatory lag meant that even technically capable inverters were not configured to deliver reactive power or synthetic inertia.
Restoration Challenges
Black‑start capability was limited to conventional plants.
The absence of grid‑forming renewables slowed restoration, as operators had to rely on a small number of synchronous units to re‑energize the system.
Grid‑Following vs. Grid‑Forming
The report underscores the fundamental difference between grid‑following and grid‑forming inverters:
Grid‑following inverters synchronize to an existing grid waveform. They are inexpensive, widely deployed, and optimized for maximum energy delivery. However, they cannot set voltage or frequency on their own.
Grid‑forming inverters can establish a stable voltage and frequency reference, mimicking the behavior of synchronous machines. They can provide reactive power, synthetic inertia, and black‑start capability.
ENTSO‑E notes that the vast majority of Iberian renewable capacity—well over 95%—is grid‑following. This imbalance left the system vulnerable when synchronous generation was scarce.
Transitioning Spain and Portugal’s renewable fleets from grid‑following to grid‑forming capability will require significant investment. The report does not provide cost estimates, but industry analyses suggest that grid‑forming inverters currently carry a premium of about $100 per kilowatt compared to conventional units. For a 100‑MW solar plant, this translates into an additional $10 million in upfront costs.
Given that Spain has more than 80 GW of installed renewable capacity, the potential system‑wide cost of retrofitting or replacing inverters could run into the billions of euros. While some existing inverters can be upgraded via software, many older units would require hardware replacement.
ENTSO‑E stresses that these costs must be weighed against the economic and social losses of large‑scale blackouts. The April 2025 event disrupted commerce, transport, and healthcare, with damages likely exceeding the incremental cost of deploying grid‑forming technology.
Policy and Market Responses
In the wake of the blackout, Spain moved quickly to revise its regulations. In June 2025, Operational Procedure 7.4 was updated to allow and encourage renewables to provide voltage and frequency support. New projects are now expected to include grid‑forming capability, particularly when paired with battery storage.
Portugal is following a similar path, with its regulator signaling that future renewable auctions will include ancillary service requirements. At the European level, ENTSO‑E is preparing recommendations for harmonized grid codes that mandate grid‑forming capability in all new inverter‑based resources.
Industry players are also responding. In August 2025, Galp announced five new battery projects in Spain and Portugal using Sungrow’s PowerTitan 2.0 grid‑forming inverters, explicitly designed to provide fast frequency response and voltage regulation. These projects are seen as early examples of the transition ENTSO‑E envisions.
The Iberian blackout highlights a challenge facing all high‑renewable systems: how to maintain stability when synchronous machines are displaced by inverter‑based resources. While Spain and Portugal were the first to experience a continent‑wide blackout under these conditions, other regions with high renewable penetration—such as Germany, Denmark, and parts of the United States—are also grappling with the same issue.
ENTSO‑E’s report frames the April 2025 event as a wake‑up call. Without rapid deployment of grid‑forming technology, Europe risks further instability as renewable penetration rises. The costs of conversion are significant, but the costs of inaction, as demonstrated in April, are far greater.
References (APA)
ENTSO‑E. (2025, October 3). Factual report on the April 28, 2025 Iberian Peninsula blackout. European Network of Transmission System Operators for Electricity. https://www.entsoe.eu.
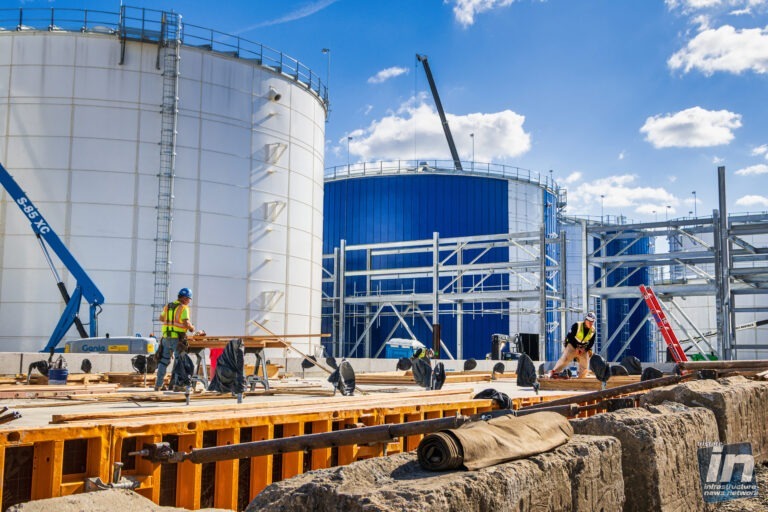
Amid the refineries and fuel depots of Linden, a different kind of energy project is emerging. The Linden Renewable Energy facility (LRE) will convert 1,475 tons of organic waste into 3,783 million BTUs of renewable natural gas (RNG) each day, channeling sustainable energy through the same pipeline network once reserved for fossil fuels. The output equals roughly 31,500 gallons of gasoline daily, enough to power thousands of homes.
At first glance, it seems out of place among the fossil-fuel giants. But that contrast may be what makes the project so significant. LRE represents both a technological milestone and a symbolic one — a demonstration that clean energy infrastructure can take root in the very heart of New Jersey’s industrial belt. Take a look inside the only large-scale green energy project currently under construction in New Jersey.
From waste to energy: how it works
At its core, the Linden Renewable Energy project (LRE) is designed to take food scraps, yard trimmings and other organic waste and turn them into usable fuel. Before arriving on site, the material is processed in de-packaging and sorting facilities where non-biodegradable items are removed. The cleaned organic matter is then delivered to Linden for processing.
The waste is placed in sealed, oxygen-free tanks where naturally occurring microbes break it down through anaerobic digestion. This process produces biogas, primarily methane and carbon dioxide, which is purified, upgraded and injected into the existing Elizabethtown Gas system as RNG.
In addition to gas, the system produces a nutrient-rich byproduct called digestate, which can be refined into fertilizer or soil conditioner. In the end, the facility takes organic material that would otherwise be discarded and transforms it into two valuable resources: clean energy and agricultural feedstock.
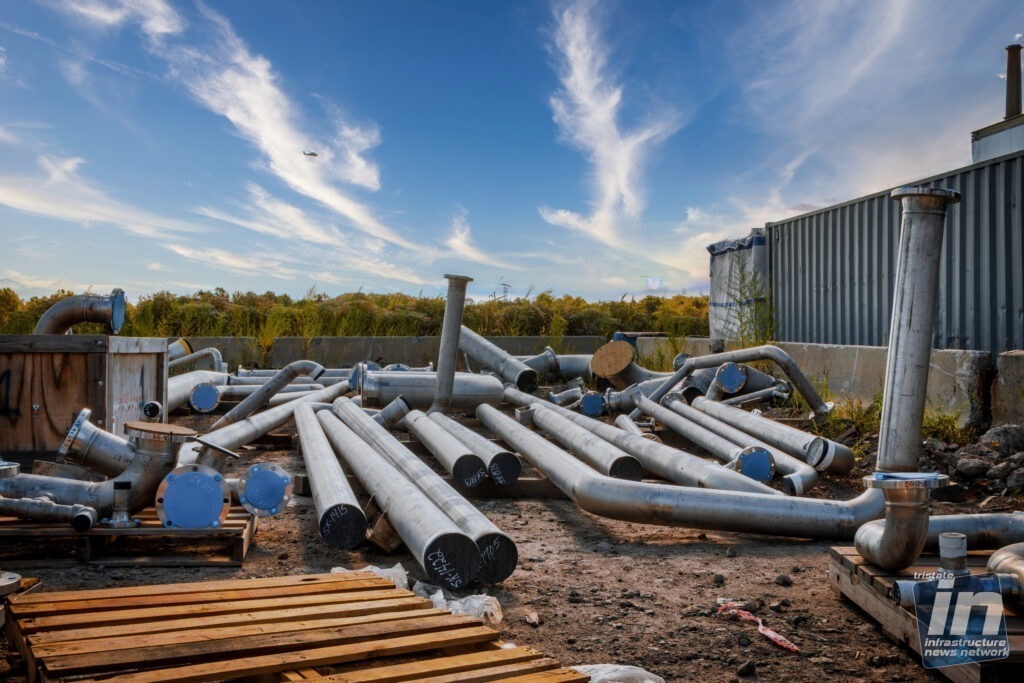
Photo Caption: Pipes awaiting installation at the Linden Renewable Energy facility will carry renewable natural gas to Elizabethtown Gas’s distribution system, where it will blend with existing natural gas supplies and serve homes and businesses across the region.
An industrial ecosystem reborn
The Linden site sits at Tremley Point Road, Block 587, Lot 8.02, within the Union County Solid Waste Management District. It’s a strategic location. The facility connects directly to existing gas infrastructure and is close to the Linden Cogen power plant, the Citgo Petroleum Terminal, and the Phillips 66 refinery.
The proximity offers clear logistical advantages. With major gas pipelines, utility corridors and industrial roadways already in place, the project can connect directly to existing systems rather than building new ones. Access to established transmission routes shortens construction timelines, reduces permitting challenges and allows renewable gas to flow into the network more efficiently. The site’s location also ensures a steady supply of utilities such as power, water, and waste management, which are all essential for large-scale processing.
The neighboring Linden Cogen plant recently began hydrogen blending, using refinery off-gas to reduce carbon emissions. With LRE adding RNG to the mix, the area is evolving into one of the most diversified energy clusters in the Northeast, a living model of how traditional and renewable systems can coexist.
A model for circular infrastructure
Linden’s significance reaches beyond renewable energy. It represents a broader shift in how infrastructure systems can intersect and adapt.
Waste infrastructure becomes energy infrastructure. Landfills and waste transfer stations can evolve into energy producers rather than endpoints.
Legacy energy assets find new purpose. Gas pipelines once built for fossil fuels are now adapting to carry renewable gas and hydrogen blends.
Co-location creates efficiency. By situating green projects alongside existing industrial networks, costs drop and permitting complexity lessens.
For infrastructure professionals, the project offers a living case study in adaptive reuse, an approach where the grid becomes more sustainable not by starting over, but by transforming what is already there.
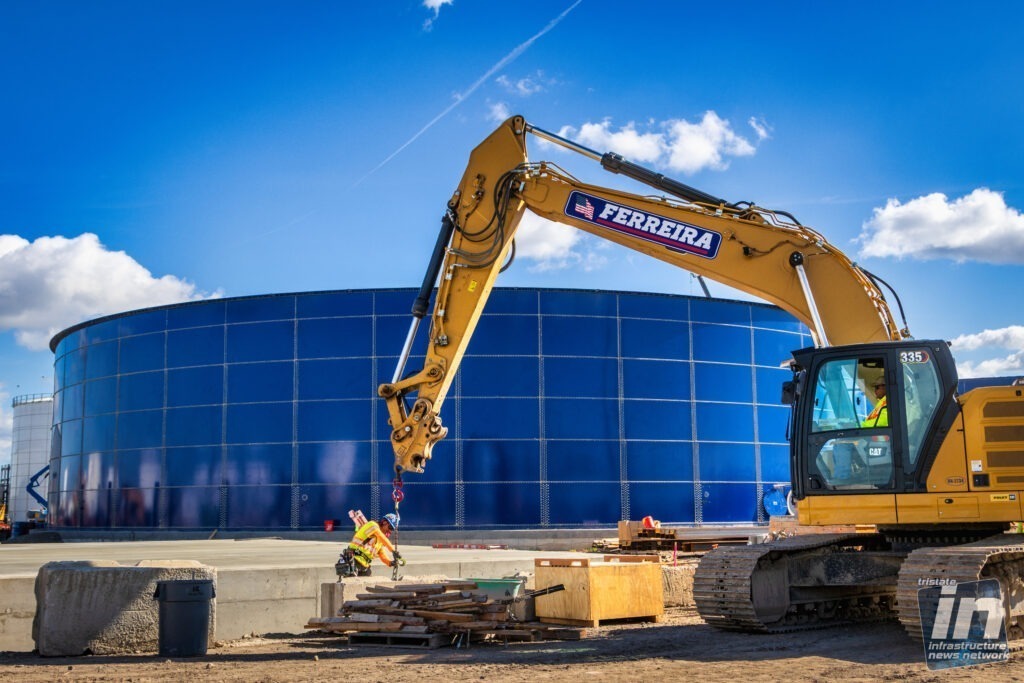
Photo caption: Holding tanks will store and process organic waste as part of the anaerobic digestion system that produces renewable natural gas (RNG). Inside these sealed tanks, microorganisms break down food waste and other organic materials to generate methane-rich biogas, which is then cleaned, upgraded, and injected into the distribution network.
The road ahead
Construction at Linden Renewable Energy is expected to continue through its commissioning phase, with full operations anticipated soon after. When complete, the plant will stand as both an engineering achievement and a statement that even in New Jersey’s most industrial corridors, a cleaner energy future can take shape. Through the maze of pipelines and refineries, the state’s next chapter in infrastructure is already being built — one tank of renewable gas at a time.
Key Project Facts
Name: Linden Renewable Energy, LLC
Location: Tremley Point Road, Linden, NJ
Partners: South Jersey Industries, Elizabethtown Gas, regional developers
Capacity: 1,475 tons of organic waste/day
Output: 3,783 million BTU/day of renewable natural gas
System Connection: Elizabethtown Gas network
Status: Under construction – New Jersey’s only active large-scale green energy build
“The rule was intended to better protect landowner rights while giving developers needed certainty, according to former FERC Chair Richard Glick, a Democrat.
But the order has since been criticized by industry and FERC leaders as a stall tactic by project opponents — a claim that environmental groups reject.”
According to the U.S. Energy Information Administration (EIA), natural gas and nuclear have fueled more than 90 percent of New Jersey’s total electricity since 2011. In 2023, natural gas accounted for 49 percent of the state’s total electricity generation and nuclear provided 42 percent. Also, about 72 percent of New Jersey households rely on natural gas as their primary heating fuel, 17 percent use electricity and about 9 percent use petroleum products. The rest use other fuels including wood and solar.
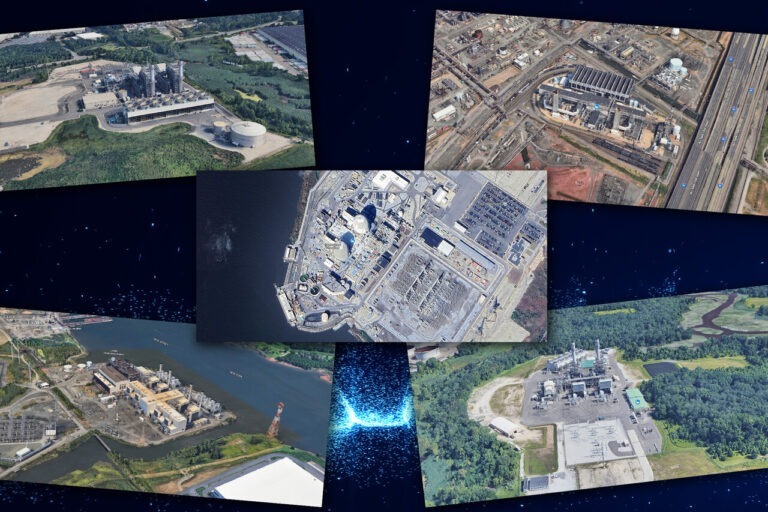
Here are the 10 largest in state generators of electricity, location, fuel source and how much power they produce, in terms of Gigawatts (GW) and the equivalent number of homes they can power.
For reference, there are ~3.5 million households in the state.
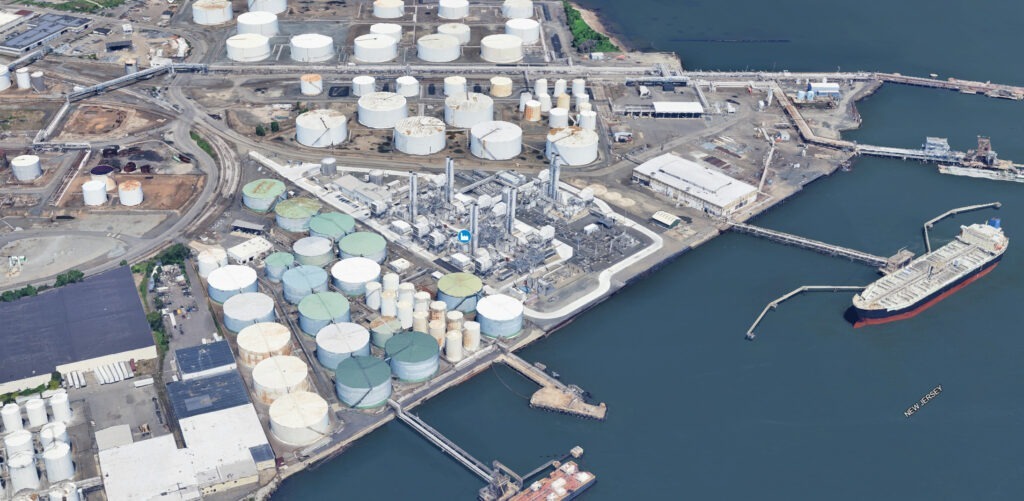
10. Bayonne Energy Center
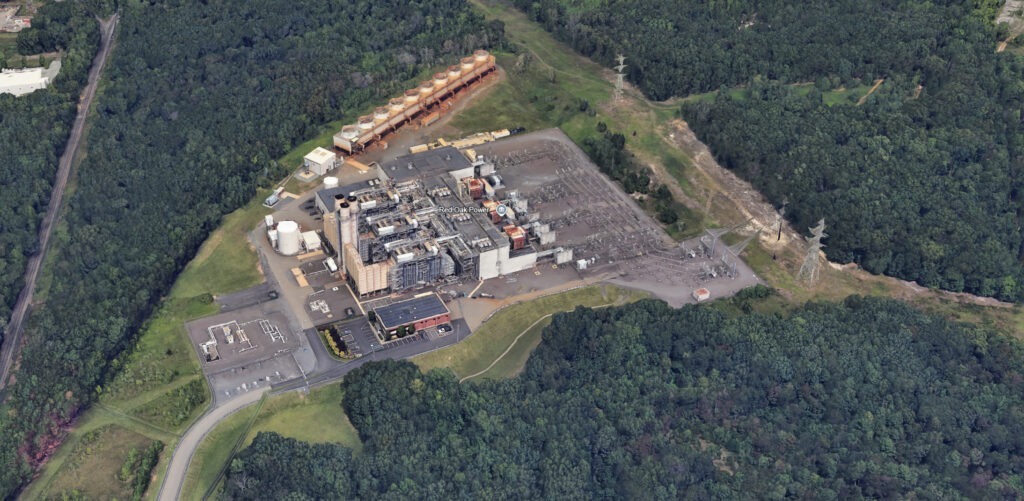
Dual fuel generating station in Bayonne, Hudson County with a capacity of ~644 MW. The plant, commissioned in 2012, and owned by TigerGenCo consists of nine natural gas turbines. The primary fuel is natural gas but in the case of a shortage the plant can also run on distillate fuel oil.
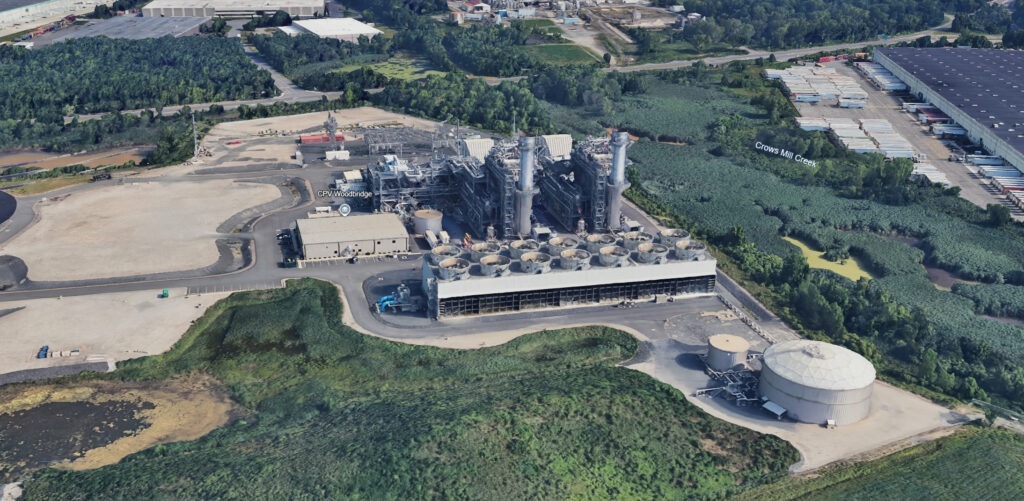
Combined cycle gas turbine project designed to run on dual fuel with a capacity of 700 MW. The primary fuel is natural gas. In case of shortage the plant can also run on ultra low sulfur diesel. It was commissioned in 2016 and is owned by Competitive Power Ventures, Osaka Gas USA and Toyota Tsusho.
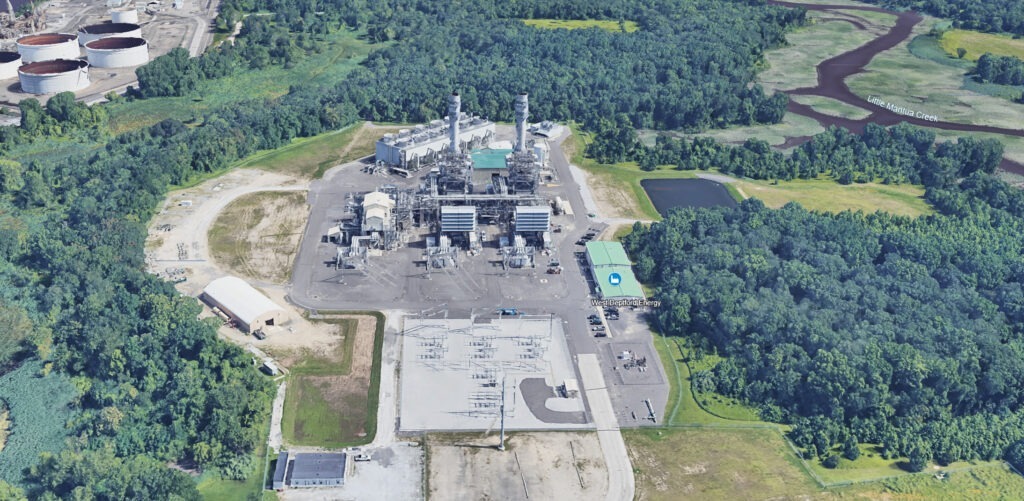
Combined cycle gas-fired generator in West Deptford, Gloucester County with a capacity of 738 MW. Commissioned in 2014 and owned by LS Power Development and partners.
Combined cycle station in Sayreville, Middlesex County with a capacity of 821 MW. Located not far from the South River it was commissioned in 2002 and is owned by the Carlyle Group.
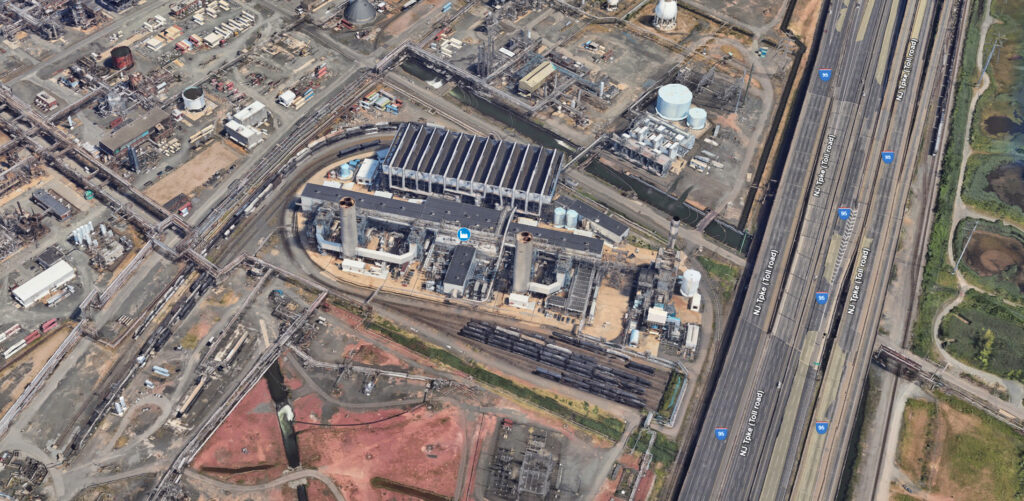
Duel fuel turbine in an operating refinery in Linden, Union County with a capacity of 974 MW that produces electricity and steam. Primarily fueled by natural gas, it can also run on waste oil in the event of a shortage. It was commissioned in 1992 and is owned by JERA.
A single unit boiling water reactor in Lower Alloways Creek, Salem County with a generating capacity of 1,240 MW. Construction began in 1974 and it began commercial operation in 1986. According to PSEG Nuclear, it can generate enough electricity to power one million homes.
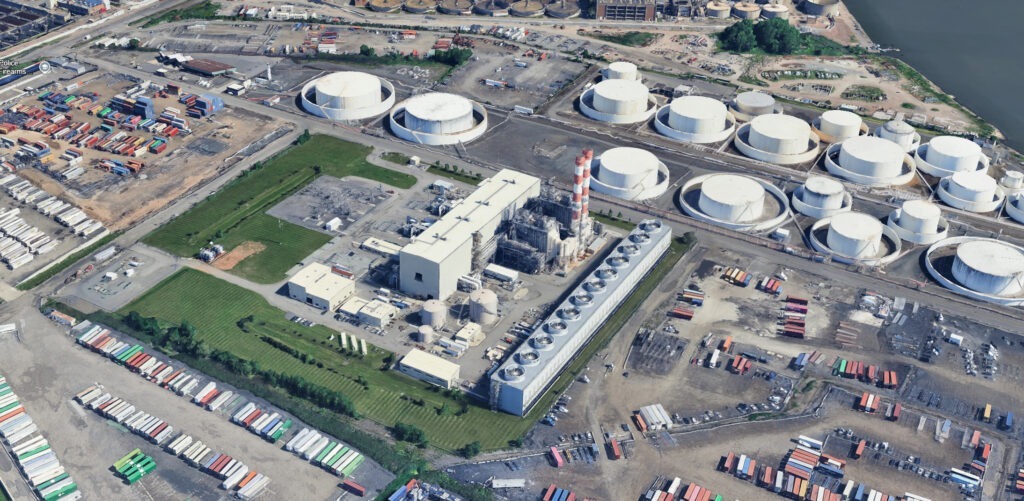
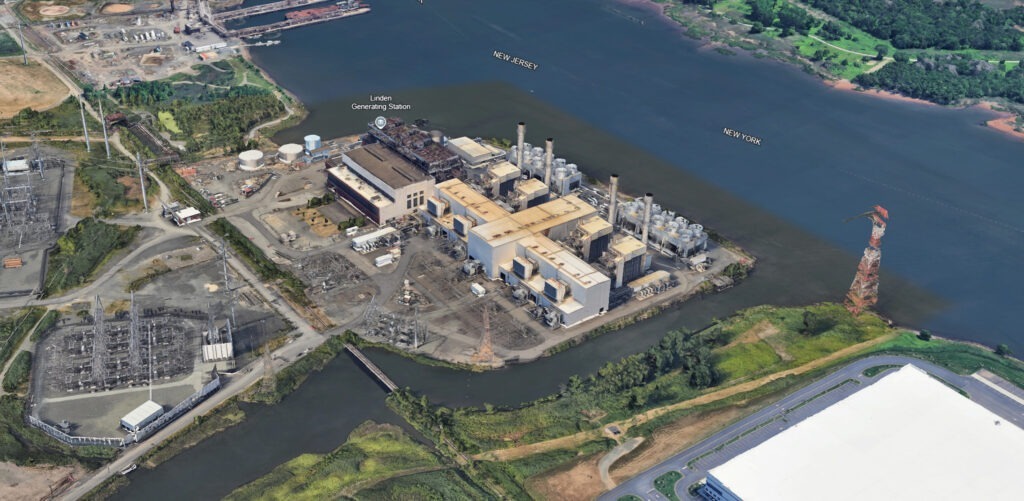
Combined cycle in Linden, Union County owned and operated by Alpha Generation. It includes four 96 MW gas turbines and two 678 MW combined cycle turbines and is capable of producing at least 1,740 MW of electricity.
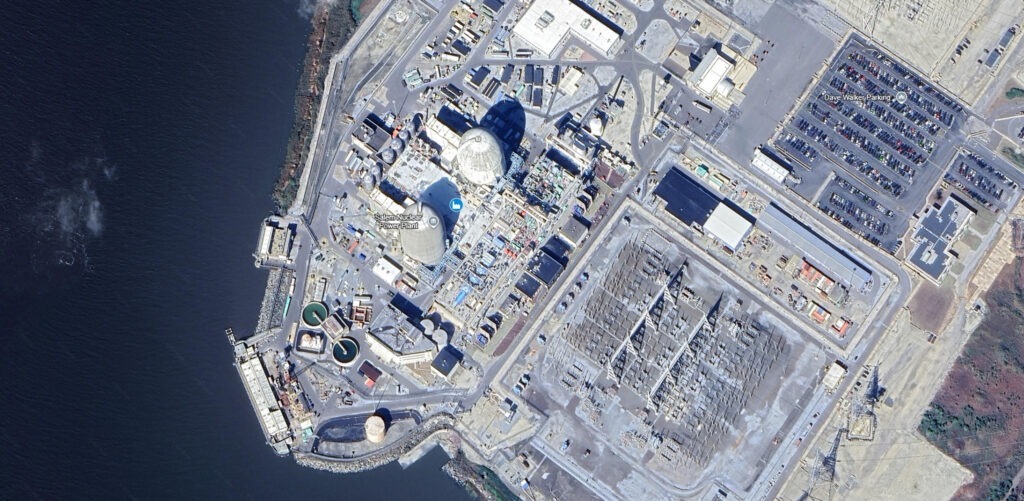
The Salem Generating Station in Lower Alloways Creek, Salem County, consists of dual unit pressurized reactors with a generating capacity of 2,454 MW. Construction began in 1968 and unit 1 began commercial service in 1977. Unit 2 began commercial service in 1981. According to PSEG Nuclear, the plant generates enough electricity to power approximately two million homes each day.
* Calculations based on Capacity Factor, which calculates real world energy output over a period of time, including scheduled maintenance, and availability of resources.
The City of Newark has completed combined sewer overflow (CSO) upgrades financed with $4.1 million in loans from the New Jersey Water Bank, qualifying for 100% principal forgiveness.
Work at the Peddie CSO site created an estimated 49 construction jobs and improved wastewater and stormwater management. The new facility prevents solids and floatable debris from entering local waterways, including the Passaic River.
NJ Transit has finalized a $1.055 billion agreement with Alstom to purchase 200 new multilevel rail cars and 12 dual-powered locomotives, replacing part of its aging diesel fleet. The order, first approved by the board in May 2025, expands NJ Transit’s total to 374 new cars as the agency works toward full fleet modernization by 2031.
The Eatontown Planning Board unanimously approved Phase 1B of the Netflix production campus at the former Fort Monmouth. The newly sanctioned 155-acre segment will serve as the project’s main entrance and central hub. This follows the May groundbreaking of the initial soundstage buildout and keeps New Jersey’s largest-ever studio project moving on schedule toward its 2028 opening.
”Asphalt pavement is one of the world’s most recycled materials. Its ingredients can be reused over and over, and recycling it is cheaper than making it new. But regulations often limit the recycled content of roads to around 30%. We visited a company making 100% recycled asphalt to see how they do it.”
With electricity rates rising year after year and the state’s increasing reliance upon importing energy from the PJM grid in the spotlight, the public conversation has shifted towards how New Jersey can bring electricity rates back down and be in control of its future by becoming energy independent.
To achieve this energy independence, New Jersey must generate an additional 6.9 million megawatt-hours (MWh) of electricity annually to replace its current imports from the regional PJM grid. This article is a high-level review of the energy technology options currently available.
A key metric in this analysis is the capacity factor, which measures a power plant’s actual energy output over time compared to its maximum possible output. For intermittent renewables like wind and solar, batteries are added to store energy and provide a more reliable supply. The scenarios below assume a battery system capable of providing 4 hours of power at the full rated capacity of the generating facility, a common industry standard for grid support.
Large-Scale Nuclear
This approach involves building a traditional, large-scale nuclear power plant for consistent, carbon-free power.
Capacity Factor: Nuclear plants are designed for continuous operation and only shut down for planned refueling and maintenance every 18-24 months. This incredible reliability means a relatively small amount of installed capacity is needed to produce a massive amount of energy. Because of this, nuclear plants have the highest capacity factor of any energy source, typically around 92%.
Power & Cost: The state would need one new large-scale reactor (approx. 1,100 MW). The upfront capital cost is enormous, ranging from $9 billion to $15 billion, with a long-term electricity cost of $140 – $220 per MWh.
Land & Time: The plant and its exclusion zone would require 1,000 to 2,000 acres. The entire project would take 10 to 15 years.
Solar + Battery Storage
This renewable path involves building vast solar farms paired with large-scale battery systems to ensure a reliable power supply.
Capacity Factor: Due to night, clouds, and weather, the capacity factor for utility-scale solar in New Jersey is low, averaging around 18%.
Power & Cost: To compensate, the state would need to install approximately 4,400 MW of solar capacity backed by a battery system that could provide 4 hours of power (17,600 MWh). The technology and construction costs are high, estimated at $11 billion to $12 billion. This figure does not include land acquisition.
Land & Time: This option is the most land-intensive, requiring over 25,500 acres. For comparison, Hudson County is 29,562 acres. The complete development and construction timeline would likely be 5 to 10 years.
Offshore Wind + Battery Storage
New Jersey has a significant offshore wind resource with stronger, more consistent winds than on land. Batteries would firm up this power for the grid.
Capacity Factor: Offshore wind has a much higher capacity factor than onshore, averaging around 45%. This means each turbine can generate more power more consistently.
Power & Cost: The state would need about 1,750 MW of new offshore capacity, backed by a battery system that could provide 4 hours of power (7,000 MWh). The offshore wind portion would cost $7B – $9B, with batteries adding another $2.5B – $3B. The total upfront cost is estimated at $9.5 billion to $12 billion.
Land & Time: While it requires no land, the turbines would occupy a sea lease area of approximately 150,000 acres. The complex development process takes 8 to 10 years.
Small Modular Reactors (SMRs)
SMRs represent a newer, more compact nuclear technology that is not yet in wide commercial operation but promises faster construction.
Capacity Factor: SMRs are designed to achieve the same high reliability as large-scale reactors, with a projected capacity factor of around 92%.
Power & Cost: The state would need a plant with 11 to 12 SMR modules (totaling about 860 MW). The projected upfront capital cost is $7 billion to $9 billion, with an estimated electricity cost of $110 to $180 per MWh.
Land & Time: SMRs are very land-efficient, requiring only 35 to 50 acres. The projected timeline is estimated at 6 to 8 years.
Coal with Carbon Capture (Scrubbing)
This scenario involves building a modern coal-fired power plant equipped with Carbon Capture and Sequestration (CCS) technology, or “scrubbers,” to capture up to 90% of CO2 emissions.
Capacity Factor: Like nuclear, coal plants are designed for baseload power and run at a very high capacity factor, around 85%.
Power & Cost: The state would need to add about 925 MW of new coal capacity. The CCS technology is extremely expensive to build and operate, bringing the total upfront capital cost to between $6.5 billion and $8.5 billion. The high cost of the technology and the energy penalty to run it result in an electricity cost of $90 – $150 per MWh.
Land & Time: A coal plant, including its fuel storage and CCS infrastructure, would require 1,200 to 2,000 acres. The project timeline, including complex permitting, would be 6 to 8 years.
Onshore Wind + Battery Storage
This scenario involves building traditional wind farms on land within the state, backed up by large-scale batteries to improve reliability.
Capacity Factor: Onshore wind in the Mid-Atlantic region has a moderate capacity factor of around 35%, limited by variable wind speeds on land.
Power & Cost: New Jersey would need to build about 2,250 MW of new wind capacity (or ~640 3.5 MW turbines), paired with a battery system that could provide 4 hours of power (9,000 MWh). The wind farm would cost $4B – $5.5B, with the batteries adding another $3B – $3.5B. The total upfront cost would be between $7 billion and $9 billion.
Land & Time: Wind farms require significant space, though most land can still be used for agriculture. This scenario would require 50,000 to 100,000 acres. The project timeline would be 4 to 7 years.
Natural Gas
This scenario uses a conventional fossil fuel technology to build one large or several smaller combined-cycle natural gas plants.
Capacity Factor: Natural gas plants have a moderate capacity factor, averaging around 56%, as their output is often adjusted to meet demand.
Power & Cost: New Jersey would need to add approximately 1,400 MW of new capacity. The capital cost is relatively low at $1.8 billion to $2.5 billion. The electricity cost is also low, typically $45 to $80 per MWh, but this comes with fuel price volatility and carbon emissions.
Land & Time: The required land would be between 700 and 1,400 acres. The project timeline is relatively fast at 4 to 6 years.
Summary
Technology
Total Upfront Cost
Levelized Cost of Energy (LCOE)
Project Time
Land/Area Required
Large-Scale Nuclear
$9-15 Billion
$140-220/MWh
10-15 years
1,000-2,000 acres
Solar + Battery
$11-12 Billion*
$90-160/MWh
5-10 years
~25,500+ acres
Offshore Wind + Battery
$9.5-12 Billion
$85-150/MWh
8-10 years
~150,000 acres (sea)
Small Modular Reactors
$7-9 Billion
$110-180/MWh
6-8 years
35-50 acres
Coal + Carbon Capture
$6.5-8.5 Billion
$90-150/MWh
6-8 years
1,200-2,000 acres
Onshore Wind + Battery
$7-9 Billion
$40-85/MWh
4-7 years
50,000-100,000 acres**
Natural Gas
$1.8-2.5 Billion
$45-80/MWh
4-6 years
700-1,400 acres
Notes
Land & Time estimates are best-case scenarios.
This analysis does not incorporate the expected load growth from population growth, AI/datacenter growth, and increased electrification of transportation and buildings.
* Total Upfront Cost for the Solar + Battery scenario does not include land acquisition, which could add over $1.2 billion to the total.
** Onshore Wind + Battery acreage represents the total leased area of the project, which is the land over which the developer has rights to place turbines. The physical footprint—the land actually occupied by turbine foundations, access roads, and substations—is only about 1-2% of that total.
U.S. Energy Information Administration (EIA). (2024, June). Electricity Data Browser: New Jersey, Net Generation and Retail Sales, All Sectors, Annual 2023. https://www.eia.gov/electricity/data/browser/



![PJM Pursues Rule Change to Meet Data Center Surge. Critics Fear Gas Suppliers Could Benefit. [Inside Climate News]](https://tristateinfrastructurenews.com/wp-content/uploads/2025/10/large-TINN-Lede-PJM-rules-changes-768x512.jpg "PJM Pursues Rule Change to Meet Data Center Surge. Critics Fear Gas Suppliers Could Benefit. [Inside Climate News]")

![FERC nixes rule that critics said impeded energy projects [E&E News]](https://tristateinfrastructurenews.com/wp-content/uploads/2025/10/large-TINN-Lede-FERC-rule-change-1-768x512.jpg "FERC nixes rule that critics said impeded energy projects [E&E News]")


![Newark Completes Overhaul of Sewer System [ROI-NJ]](https://tristateinfrastructurenews.com/wp-content/uploads/2025/10/large-The-Peddie-Ditch-facility-Newark-Department-of-Water-and-Sewer-Utilities-696x453-1.jpg "Newark Completes Overhaul of Sewer System [ROI-NJ]")
![Modern Rail Era Begins: NJ Transit Moves to Replace Aging Fleet by 2031[NJBIZ]](https://tristateinfrastructurenews.com/wp-content/uploads/2025/10/large-NJ-Transit3-768x470.jpg "Modern Rail Era Begins: NJ Transit Moves to Replace Aging Fleet by 2031[NJBIZ]")
![Second phase of Netflix’s $900M studio wins approval in Eatontown [Two River Times]](https://tristateinfrastructurenews.com/wp-content/uploads/2025/10/trt-lede-image-768x512.png "Second phase of Netflix’s $900M studio wins approval in Eatontown [Two River Times]")