



Origins, Governance, and Challenges
Origins and purpose
The Port Authority of New York and New Jersey (PANYNJ) was created to address a regional problem: the New York–New Jersey harbor was economically interconnected, but decisions about its ports, terminals, and transportation facilities were divided among governments on both sides of the state line. In 1921, New York and New Jersey established a joint authority through an interstate compact approved by Congress. Its original name was the Port of New York Authority; it adopted its current name in 1972, reflecting a mission that had grown beyond port operations.
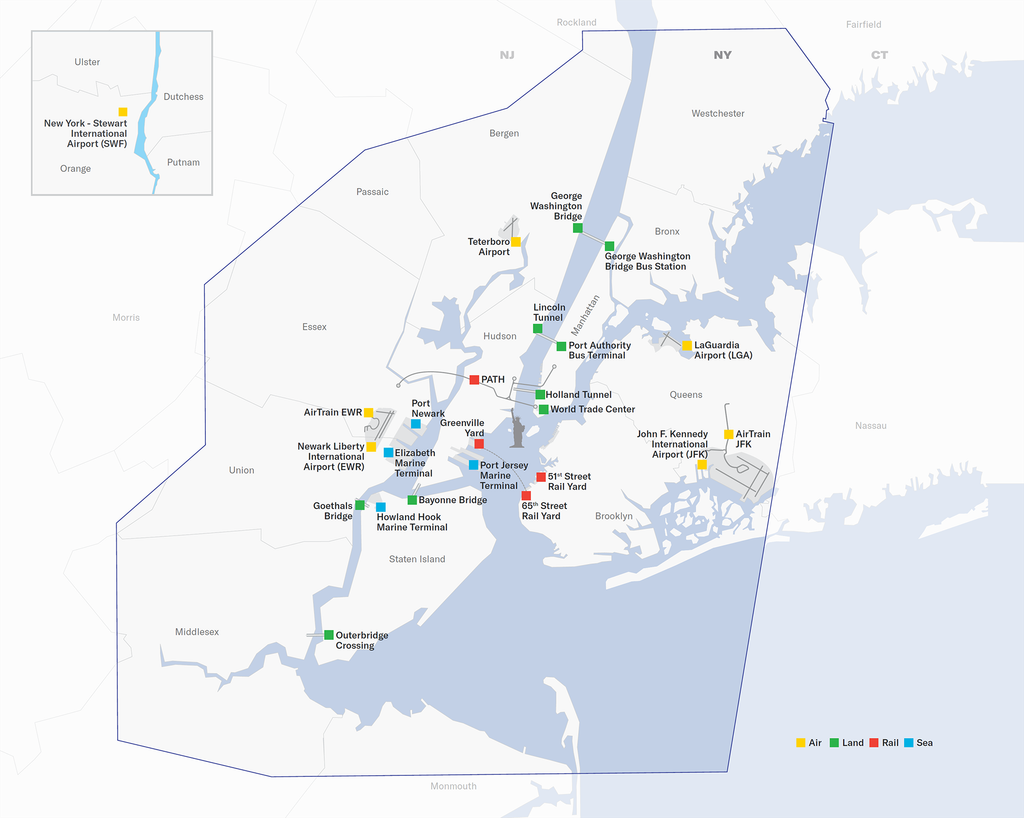
The compact gave the agency authority to plan, build, operate, and charge user fees for facilities serving the bistate district. In its early years, the agency built bridges connecting New Jersey to Staten Island, including the Goethals Bridge, Outerbridge Crossing, and Bayonne Bridge, all opened in 1928 or 1931. Its responsibilities later expanded to include the George Washington Bridge, the Holland and Lincoln tunnels, PATH, airports, seaports, bus terminals, and the World Trade Center.
SOURCE: PANYNJ
Governance and funding
PANYNJ is governed by a 12-member board: New York’s governor appoints six commissioners, and New Jersey’s governor appoints six. Each state’s Senate confirms its governor’s appointees, and each governor can veto actions by commissioners from that state. The board sets policy and appoints an executive director to oversee day-to-day operations. This arrangement gives both states a formal voice in decisions affecting a region whose travel and economic networks cross state boundaries.
The agency has no taxing authority and does not receive routine tax revenue from the states. It funds its operations and projects through tolls, fares, rents, fees, grants for eligible work, and borrowing. Its bonds are repaid from agency revenues. Since some facilities generate more income than others, the Port Authority manages a systemwide portfolio rather than funding each operation solely from its own receipts. PATH, for example, has different financial characteristics from the agency’s major toll bridges and tunnels. To manage financial stability, the Port Authority maintains two reserve funds—the General Reserve Fund and the Consolidated Bond Reserve Fund—and follows a policy of keeping their combined balance equal to at least two years of upcoming bonded debt service.
The board approved a $45 billion capital plan for 2026–2035. The approved 2026 budget totals $10 billion, including $4 billion for capital investment and $1.7 billion for debt service. Those figures show both the scale of the agency’s infrastructure responsibilities and the continuing cost of financing major projects. Additionally, an earlier $1.0 billion Superstorm Sandy Program allocated funds across the 2014–2023 period for permanent repair, mitigation, and resiliency projects.
Bridges
George Washington Bridge
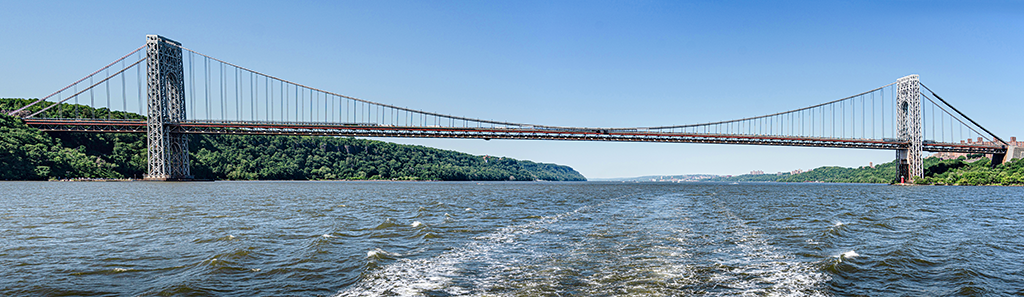
| Type | Suspension |
| Year Built | 1931 (upper level), 1962 (lower level) |
| Number of Lanes | 14 lanes |
| Total Length | 8,400 ft (2,560 m) |
| Traffic Carried | ~9,000,000 vehicles/month |
| Recent/planned updates | “Restoring the George” program ($2.0 billion, begun 2015, over 60% complete) |
Connecting Manhattan and Fort Lee, New Jersey, the GWB is the busiest vehicular bridge in the world.. The upper level opened in 1931, initially with six lanes; two more lanes were added in 1946. The six-lane lower level opened in 1962, bringing the bridge to its present 14 lanes. The “Restoring the George” program, begun in 2015, includes major work on the bridge’s main cables and suspender ropes, along with other rehabilitation. The program is more than 60 percent complete.
Goethals Bridge
| Type | Cable truss (1928), Cable-stayed (2018) |
| Year Built | 1928, Replaced 2018 |
| Number of Lanes | 6 lanes |
| Total Length | 7,300 ft (2,225 m) |
| Traffic Carried | ~2,800,000 vehicles/month |
| Recent/planned updates | Full replacement ($1.5 billion, eastbound 2017, westbound 2018, path 2020) |
The original bridge opened in 1928 between Elizabeth and Staten Island. After decades of traffic growth, its narrow lanes and aging structure led to a full replacement. The new eastbound span opened in 2017 and the westbound span in 2018. The replacement has six lanes, wider shoulders, and space for a shared pedestrian and bicycle path, which opened in 2020. It also preserves room for possible future transit improvements while serving as a key freight and commuter corridor connecting New Jersey directly to Staten Island.
Bayonne Bridge
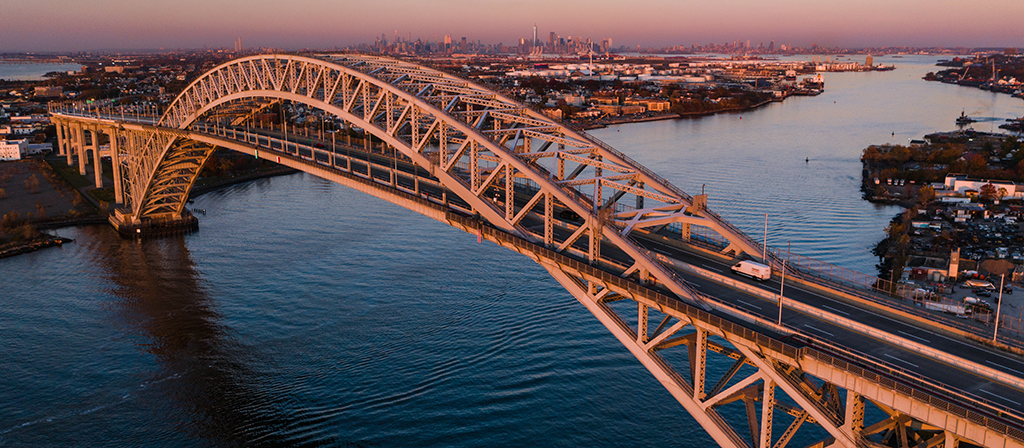
| Type | Thru-arch |
| Year Built | 1931 |
| Number of Lanes | 4 lanes |
| Total Length | 5,780 ft (1,762 m) |
| Traffic Carried | ~1,200,000 vehicles/month |
| Recent/planned updates | Roadway raised 64 ft ($1.7 billion, 2013–2019) |
This steel arch bridge opened in 1931 with four lanes between Bayonne and Staten Island. Its largest recent upgrade raised the roadways by about 64 feet to allow larger cargo ships to pass beneath it on their way to port facilities. The work took place from 2013 to 2019, representing about 4.1% of the Port Authority’s major capital investment dollars during the 2014–2023 planning horizon. The modernized roadway opened fully in 2019, retaining the iconic arch.
Outerbridge Crossing
| Type | Cantilever truss |
| Year Built | 1928 |
| Number of Lanes | 4 lanes (2 in each direction) |
| Total Length | 10,140 ft (3,090 m) |
| Traffic Carried | ~2,500,000 vehicles/month |
| Recent/planned updates | $336 million allocated for rehabilitation in current capital plan |
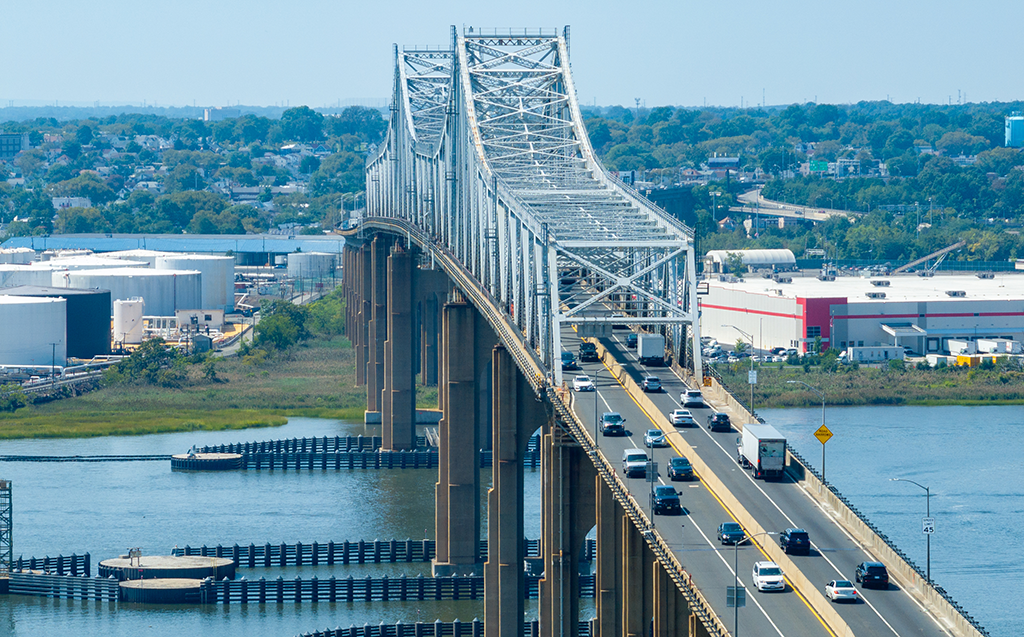
Opened in 1928 between Perth Amboy and Staten Island, the Outerbridge Crossing is the oldest bridge connecting New Jersey and New York. Unlike Goethals, it has not been replaced or widened. Serving as a key southern arterial between New Jersey and Staten Island, the current capital plan provides $336 million for rehabilitation in preparation for an eventual replacement, but that does not mean a replacement has begun or has a near-term construction date. Widening and replacement options have also been studied.
Tunnels
Lincoln Tunnel
| Year Built | 1937 (Center Tube), 1945 (North Tube), 1957 (South Tube) |
| Total Length | 8,216 ft (2,504 m) max tube length |
| Traffic Carried | ~2,800,000 vehicles/month |
| Recent/planned updates | Helix rehabilitation of structure, roadway, and deck ($640 million included in 2026–2035 capital plan) |
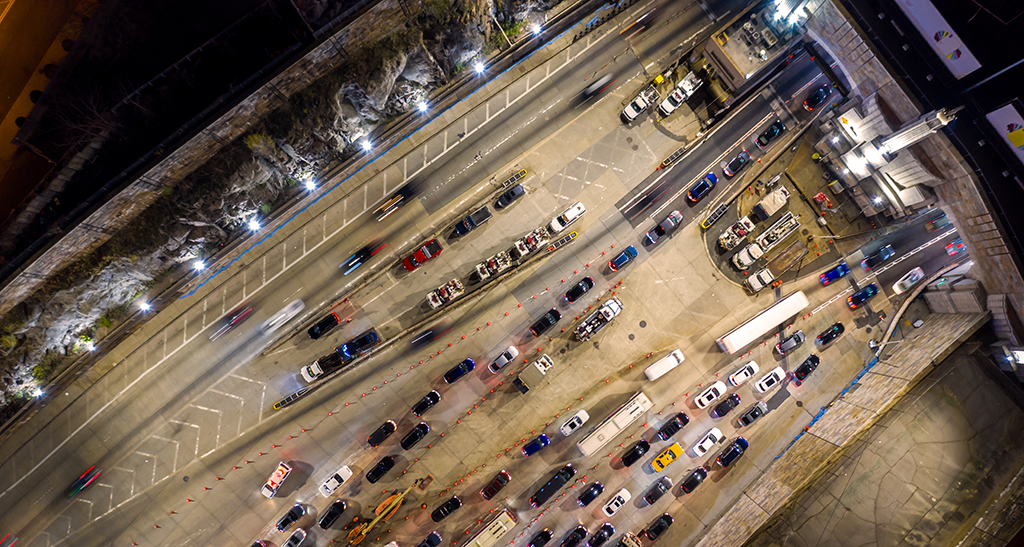
The tunnel’s three two-lane tubes opened in stages: the center tube in 1937, the north tube in 1945, and the south tube in 1957. The center tube can be operated to accommodate reversible traffic. In 1970, an exclusive bus lane opened to help buses reach the tunnel during the morning commute.
Holland Tunnel
| Year Built | 1927 |
| Total Length | 8,558 ft (2,608 m) max tube length |
| Traffic Carried | >3,000,000 vehicles/month |
| Recent/planned updates | Post-Sandy repairs and flood protection (extending into 2025) |
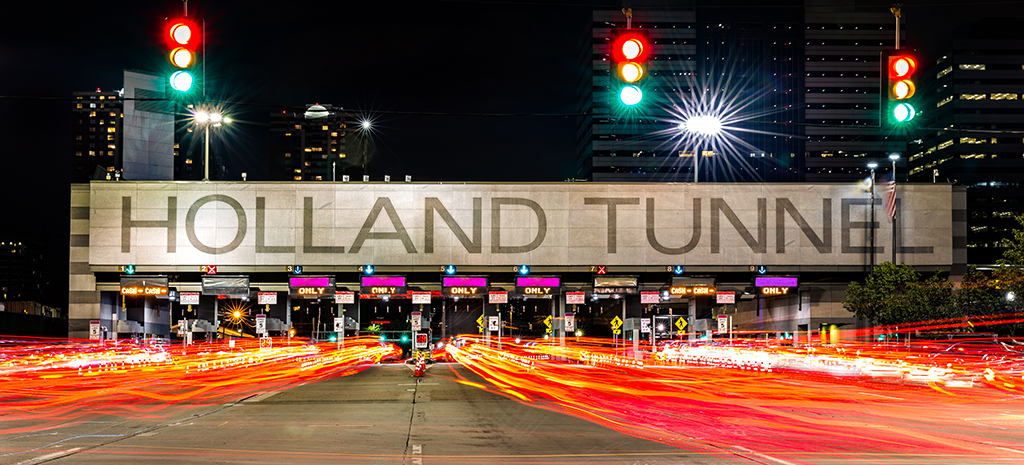
Opened in 1927 between Jersey City and Lower Manhattan, the tunnel was an engineering milestone in the use of mechanical ventilation for road tunnels. Each of its two tubes carries two lanes. Superstorm Sandy flooded parts of the facility in 2012, damaging electrical, mechanical, and structural systems. The ensuing rehabilitation included repairs and flood-protection measures, with substantial work carried out through overnight closures and programs extending into 2025.
Airports
John F. Kennedy International Airport (JFK)
| Role / Focus | Major international and domestic gateway |
| Passenger Volume | Part of system serving >140 million passengers annually |
| Recent/planned updates | Comprehensive capital redevelopment |
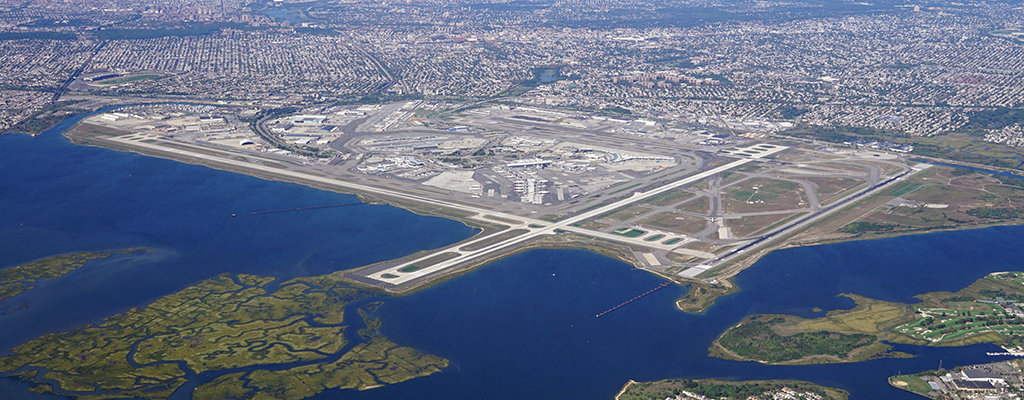
JFK serves as a major international and domestic gateway for New York City and anchors one of the world’s busiest airport systems.
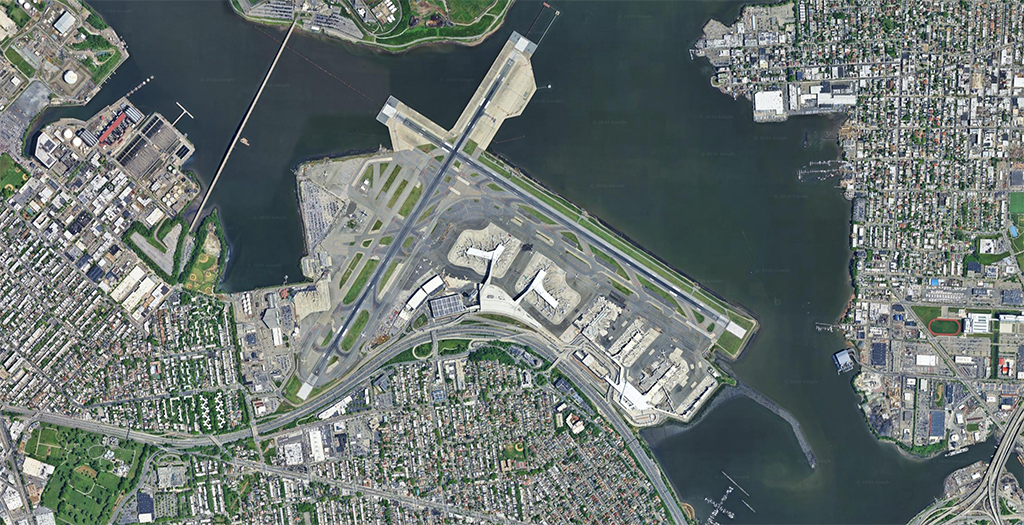
LaGuardia Airport (LGA)
SOURCE: Google
| Role / Focus | Major domestic gateway |
| Passenger Volume | Part of system serving >140 million passengers annually |
| Recent/planned updates | Comprehensive capital redevelopment |
LGA functions as a key domestic gateway for New York City within the regional airport system.
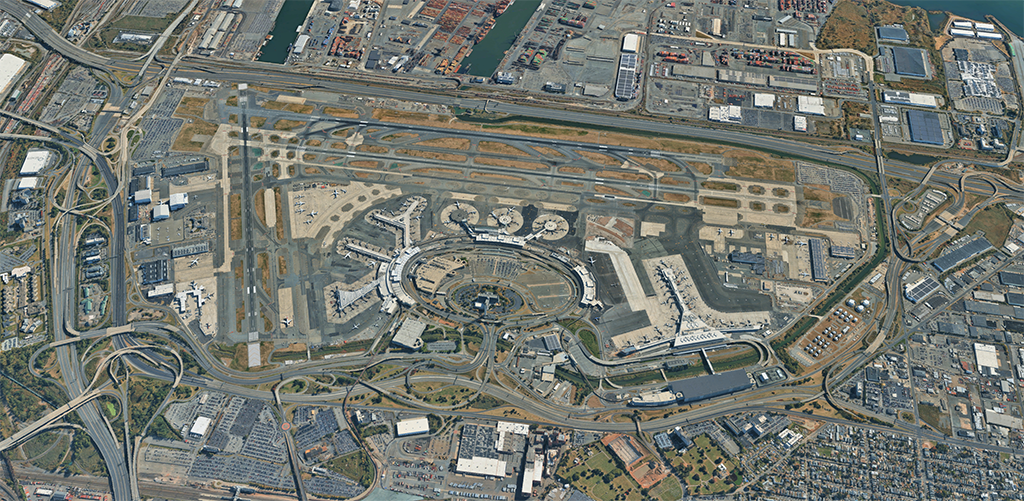
Newark Liberty International Airport (EWR)
SOURCE: Google
| Role / Focus | Major regional, domestic, and international hub |
| Passenger Volume | Nearly 50 million annually (2025) |
| Recent/planned updates | Completion of $2.7 billion Terminal A (2023), $110 million Terminal A expansion, $3.5 billion AirTrain replacement |
EWR is a vital international and domestic hub serving New Jersey and the broader New York metropolitan region. Terminal A, completed in 2023, handled approximately 18 million passengers in 2024, nearly 40% above initial forecasts.
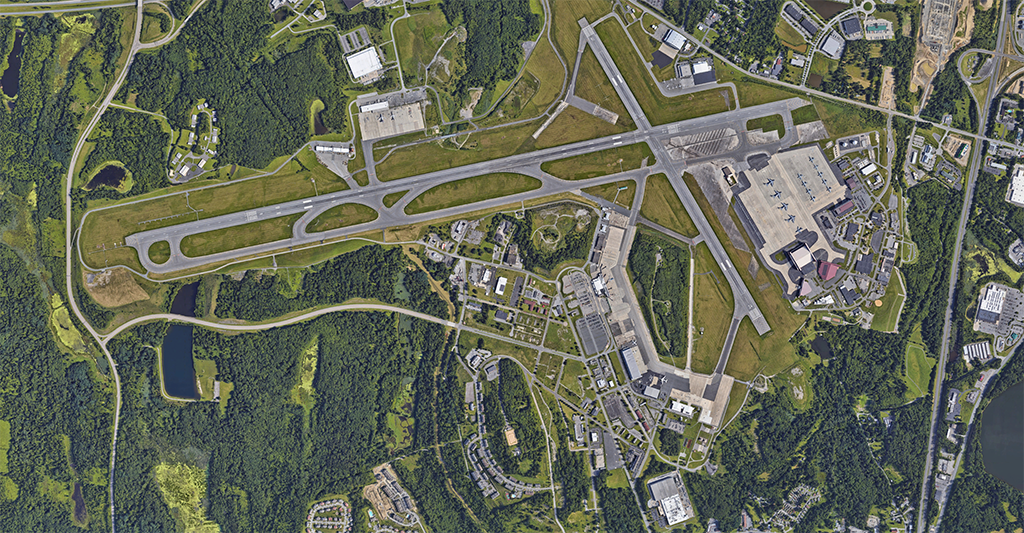
New York Stewart International Airport (SWF)
SOURCE: Google
| Role / Focus | Regional airport gateway |
| Passenger Volume | Part of system serving >140 million passengers annually |
| Recent/planned updates | Ongoing systemwide capital investments |
SWF serves as a regional airport within the Port Authority’s five-airport system, expanding regional travel options.
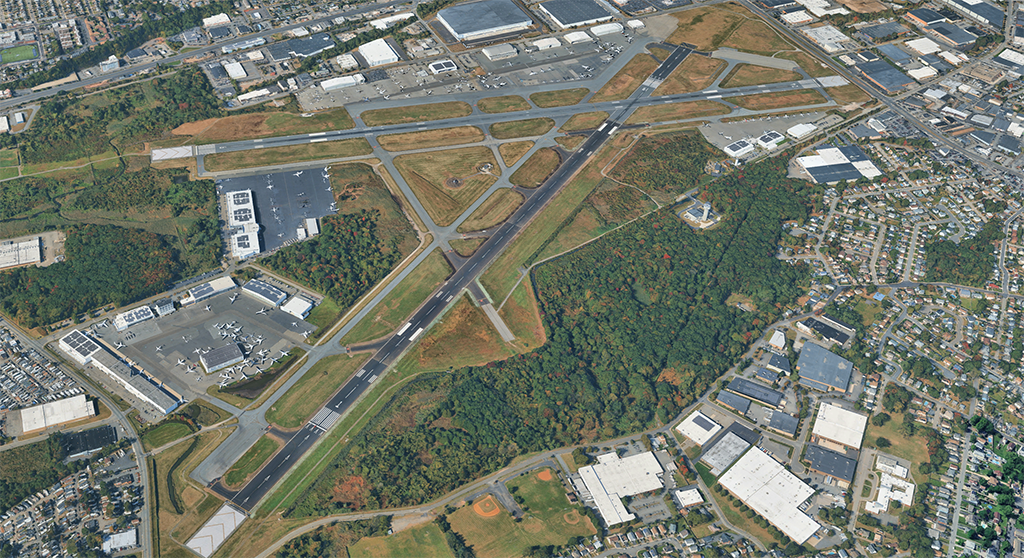
Teterboro Airport (TEB)
SOURCE: Google
| Role / Focus | General aviation and business airport |
| Passenger Volume | General aviation operations |
| Recent/planned updates | Systemwide facility maintenance and capital investments |
TEB operates as a general aviation facility, relieving commercial congestion at the primary regional airports.
Transit Facilities
Port Authority Trans-Hudson (PATH)
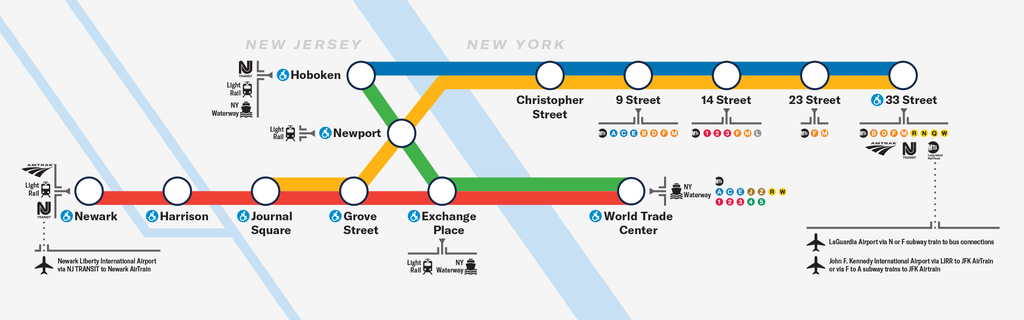
| Role / Focus | 24/7 intermodal rapid transit system |
| Passenger Volume | 60.7 million passengers annually (2025) |
| Recent/planned updates | Systemwide reliability and station capacity improvements |
The Port Authority Trans-Hudson (PATH) rail system provides 24/7 intermodal connections across 13 stations between New Jersey and Manhattan, welcoming 60.7 million passengers in 2025. It serves as a vital rapid transit link connecting New Jersey communities directly to New York’s primary commercial hubs.
Port Authority Bus Terminal (PABT)
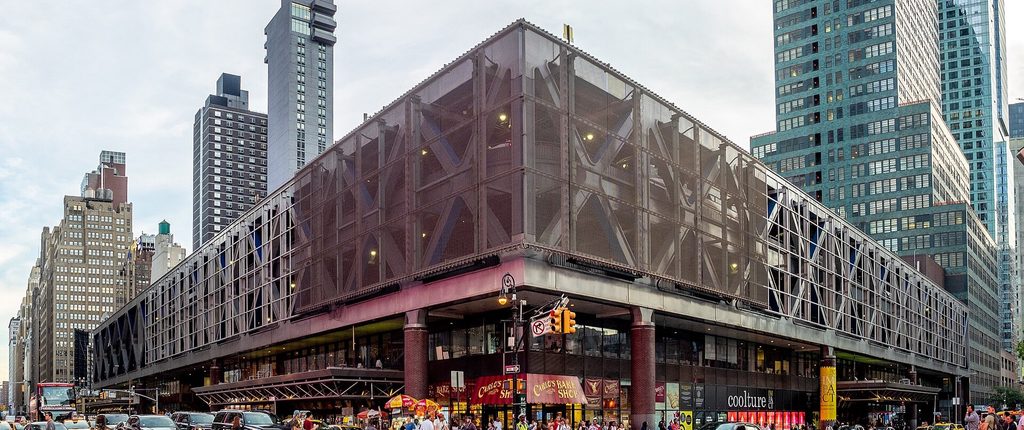
SOURCE: ajay_suresh CC BY 2.0, https://commons.wikimedia.org/w/index.php?curid=115560350
| Role / Focus | Major interstate bus hub and transit center |
| Passenger Volume | ~200,000 passenger trips per weekday |
| Recent/planned updates | Comprehensive facility redevelopment and modernization project |
The Port Authority Bus Terminal (PABT) in Midtown Manhattan, alongside the Journal Square Transportation Center in Jersey City, serves as essential public transit infrastructure. PABT is the nation’s busiest bus station, historically accommodating around 200,000 passenger trips and several thousand bus movements per weekday to link commuters across state lines.
Journal Square Transportation Center
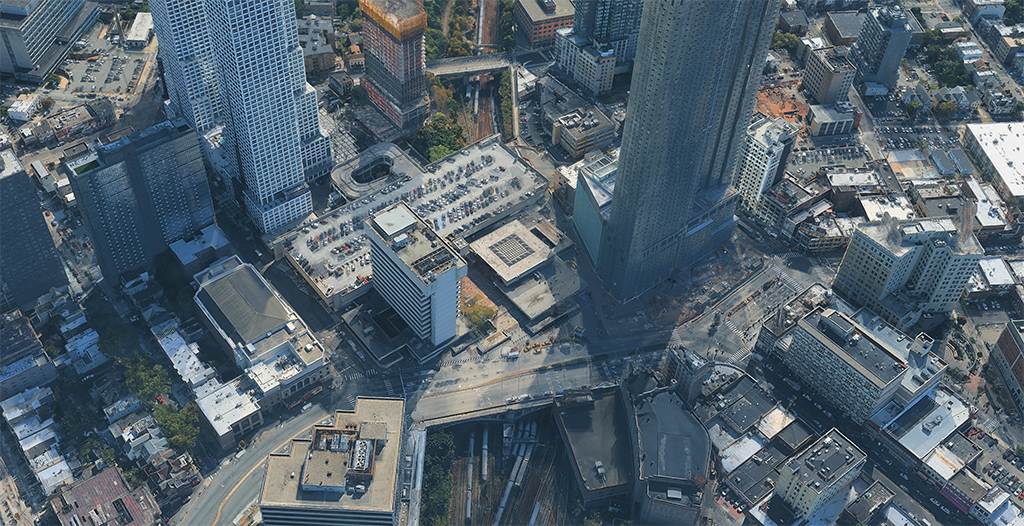
SOURCE: Google
| Role / Focus | Major multi-modal transportation hub and bus terminal |
| Passenger Volume | Serves tens of thousands of daily commuters and PATH passengers |
| Recent/planned updates | Ongoing facility upgrades and transit-oriented development integration |
Located in Jersey City, the Journal Square Transportation Center serves as a vital multi-modal transit hub connecting PATH rail service, local and interstate bus lines, and commercial facilities to support seamless regional commuting.
George Washington Bridge Bus Station
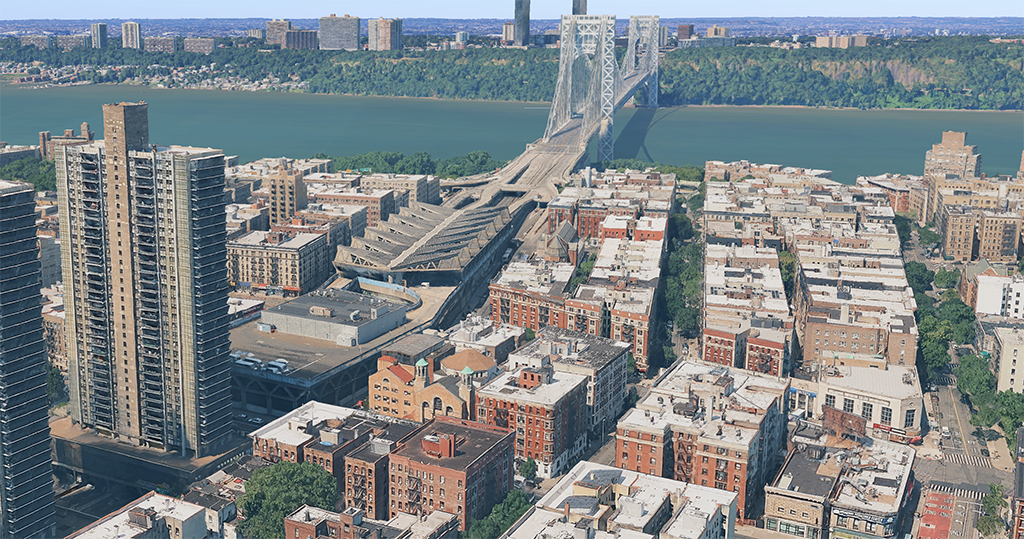
SOURCE: Google
| Role / Focus | Suburban commuter and interstate bus terminal |
| Passenger Volume | Serves thousands of daily commuters between NJ and NYC |
| Recent/planned updates | Facility modernization and improved subway connectivity |
Located in Washington Heights in Upper Manhattan, the George Washington Bridge Bus Station serves as a critical intermodal hub connecting northern New Jersey bus commuters directly to the New York City subway system and local transit networks.
Marine Terminals
As the largest East Coast port complex and third largest port in the nation (behind Los Angeles and Long Beach), the Port Authority’s marine terminals handled roughly 8.9 million TEUs in 2025. Serving as the primary maritime gateway for the Northeast Megalopolis, the complex underpins supply chains and trade across a 31-county region spanning New York, New Jersey, and Pennsylvania. The table below summarizes the top 10 import and export commodities moved through the Port Authority in 2023:
| Commodity | Imports (2023, TEUs) | Exports (2023, TEUs) |
| Furniture / Vehicles and parts etc | 488,212 | 265,936 |
| Appliances, machinery & parts / Wood pulp (waste & scrap) | 324,610 | 205,716 |
| Plastics and articles thereof | 292,747 | 76,018 |
| Beverages, spirits and vinegar / Wood and articles of wood | 202,589 | 58,036 |
| Electric machinery & parts / Appliances, machinery & parts | 199,979 | 52,880 |
| Vehicles & parts / Food industry residues & waste | 147,828 | 40,969 |
| Articles of rubber / Aluminum and articles thereof | 131,997 | 36,781 |
| Articles of iron or steel / Electronics | 121,862 | 28,930 |
| Apparel and accessories, knit / Iron and steel | 120,887 | 28,306 |
| Toys, games & sport equipment / Oil seeds, grain, seed, fruit, plant | 112,694 | 26,347 |
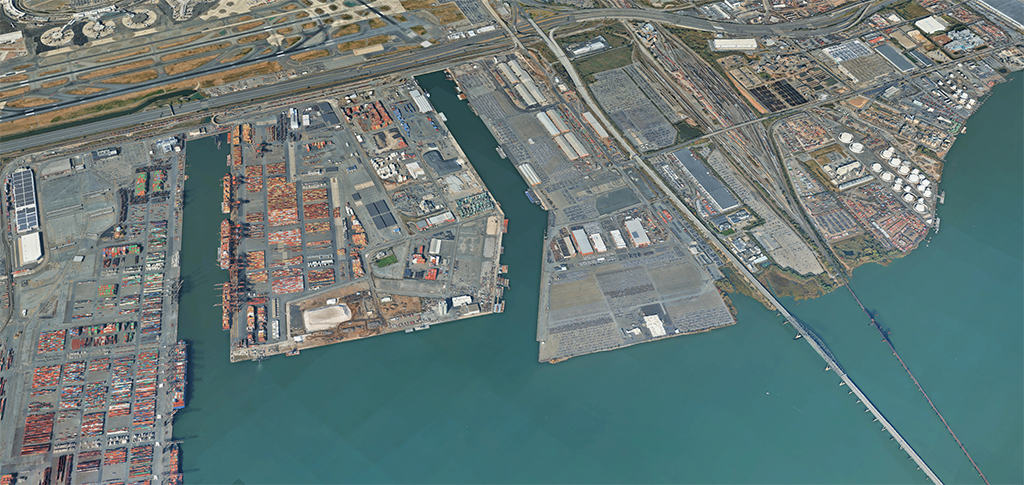
Port Newark (USNWK)
SOURCE: Google
| Role / Focus | Major containerized cargo, auto, and bulk marine terminal |
| Cargo Volume / Significance | Key facility within the largest East Coast port complex; handles heavy container and truck traffic |
| Recent/planned updates | Billion-dollar expansion program, berth modernizations, logistics capacity upgrades, and $45M electric truck/charging program |
Port Newark serves as a primary engine for containerized and bulk cargo operations within the Port Authority’s maritime network. Heavy truck movement – including a significant portion of the roughly 30,000+ daily drayage and cargo truck trips moving through the Port Newark–Elizabeth corridor and across the Newark Bay Bridge – relies on this facility to support freight distribution across the 31-county region.
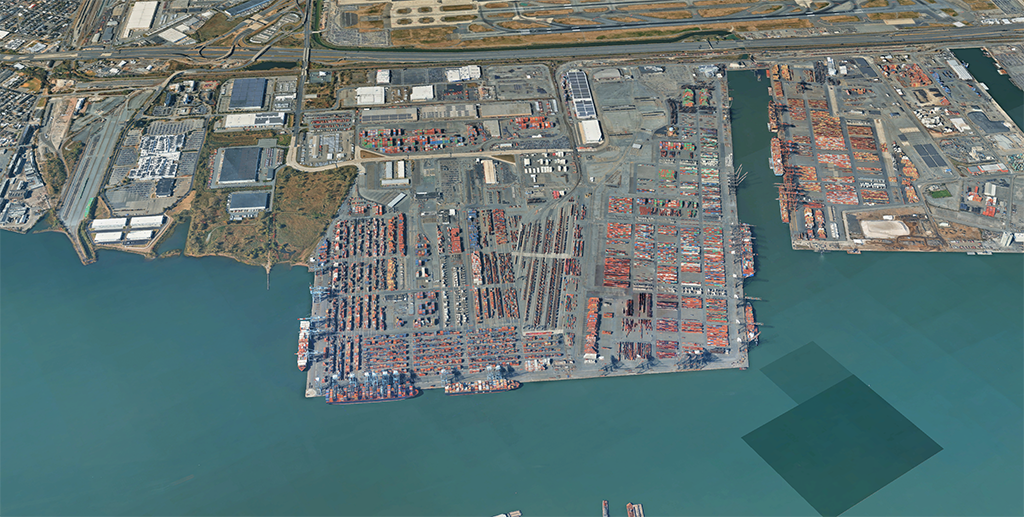
Elizabeth Marine Terminal (USELZ)
SOURCE: Google
| Role / Focus | Major container shipping and intermodal freight hub |
| Cargo Volume / Significance | Anchors primary container processing operations along the Elizabeth-Newark corridor |
| Recent/planned updates | Ongoing berth and channel improvements to support ultra-large container vessels |
The Elizabeth Marine Terminal is a vital containerized cargo hub, providing modern berth capacity and direct rail and highway intermodal connections for major ocean carriers.
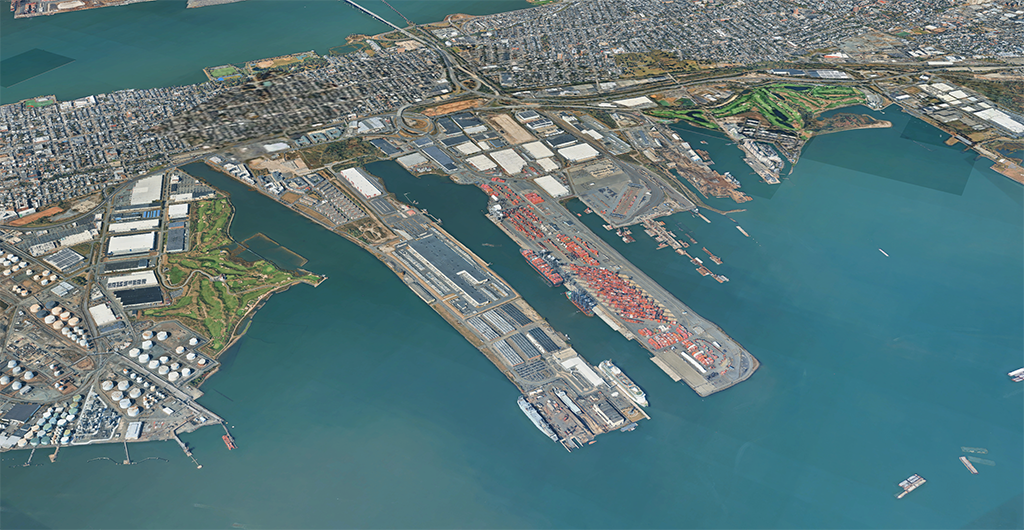
Port Jersey Port Authority Marine Terminal (USPJE)
SOURCE: Google
| Role / Focus | Deepwater container terminal and logistics facility |
| Cargo Volume / Significance | Strategic deep-water access serving Bayonne and Jersey City maritime commerce |
| Recent/planned updates | Terminal automation, express rail expansion, and efficiency upgrades |
Located on Upper New York Bay in Jersey City and Bayonne, Port Jersey provides deep-water container handling capabilities backed by direct rail connectivity.
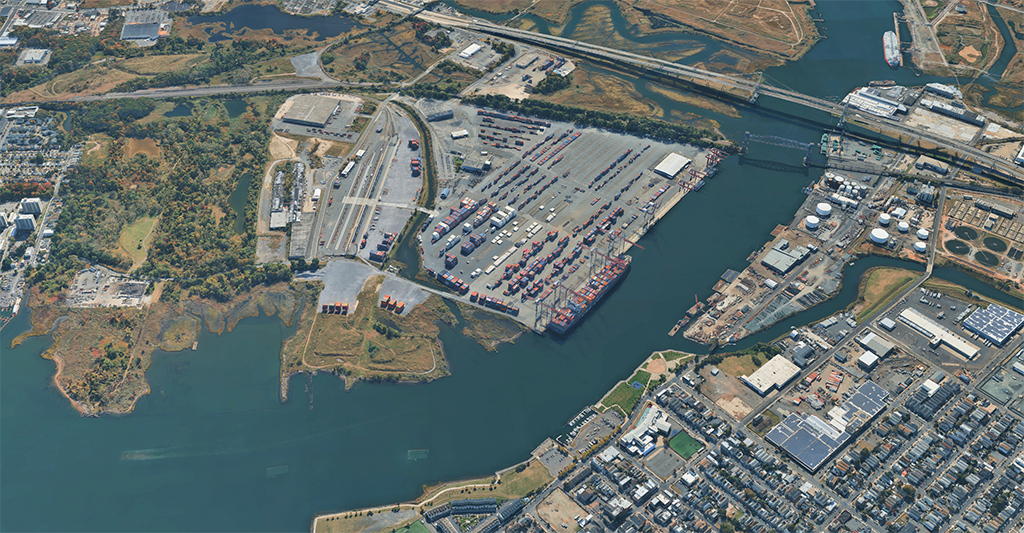
Howland Hook Marine Terminal (USHHT)
SOURCE: Google
| Role / Focus | Staten Island container facility and intermodal rail hub |
| Cargo Volume / Significance | Key New York-side container terminal providing regional freight access |
| Recent/planned updates | Facility modernization, berth deepening, and expanded intermodal rail connections |
Situated on Staten Island, Howland Hook Marine Terminal offers key container processing capacity and intermodal rail connections supporting New York regional supply chains.
Security and enforcement
Safety and security operations remain a top priority, supported by a record investment of over $1 billion in the 2025 budget. The Port Authority Police Department (PAPD) reinforced its workforce of more than 2,100 members by welcoming 71 new recruits in its 123rd Academy class in June 2025. Enforcement efforts in 2025 targeted toll evasion, resulting in more than 10,000 summonses issued across the six bridges and tunnels, 176 arrests, 548 impounded vehicles, and $17 million recovered in unpaid tolls and fees. At the regional airports, enhanced deterrence against illegal for-hire vehicles produced over 2,800 unlawful solicitation summonses and 550 arrests.
Challenges ahead
The Port Authority’s central challenge is to modernize aging infrastructure without interrupting the daily movement of people and goods. Large-scale work must be coordinated around heavy traffic, while airport, transit, and port facilities continue operating. Resilience is also a major concern: Sandy’s damage to the Holland Tunnel demonstrated how flooding can affect complex systems and require extensive repairs.
Financing the next generation of projects is another challenge. The agency says the pandemic reduced revenue by $3 billion, while inflation, supply-chain issues, tariffs, and higher interest rates increased project and borrowing costs. It must balance debt service and major construction with routine maintenance, safety, security, and transportation services that do not fully pay for themselves.
Finally, the agency’s bistate structure requires New York and New Jersey to cooperate on investment priorities, tolls, and how benefits are distributed across the region. That model allows coordinated action across state lines, but it also makes consensus essential. PANYNJ’s long-term task is to preserve and upgrade the infrastructure it inherited while keeping the region’s transportation network reliable, resilient, and financially sustainable.
Sources:
Port Authority of New York and New Jersey. (2025). 2025 Annual Report & Budget Statement. https://www.panynj.gov/port-authority/en/annual-report.html
Port Authority of New York and New Jersey. (2024). 2026–2035 Capital Plan & 2017–2026 Capital Plan. https://www.panynj.gov/content/dam/path/station/path-extension-project/documents/Capital_Plan_2017-2026_EiA0hGv.pdf
Port Authority of New York and New Jersey. (2025). Bridges & Tunnels Traffic & Volume Information. https://www.panynj.gov/bridges-tunnels/en/traffic—volume-information—b-t.html
Port Authority of New York and New Jersey. (2025). Financial Statements & Debt Service Documentation. https://www.panynj.gov/port-authority/en/financial-information.html
Port Authority of New York and New Jersey. (2023). 2023 At a Glance. https://www.panynj.gov/content/dam/port/our-port/PONYNJ_AtAGlance2023.pdf